Features — a tab-by-tab tour
A host pill bar at the top switches between the local box and any remote you've registered; every tab scopes to the active host. Here's what each one shows.
Screenshots are from a live 56-core / RTX 3090 host
Network identifiers are redacted; everything else is real data.
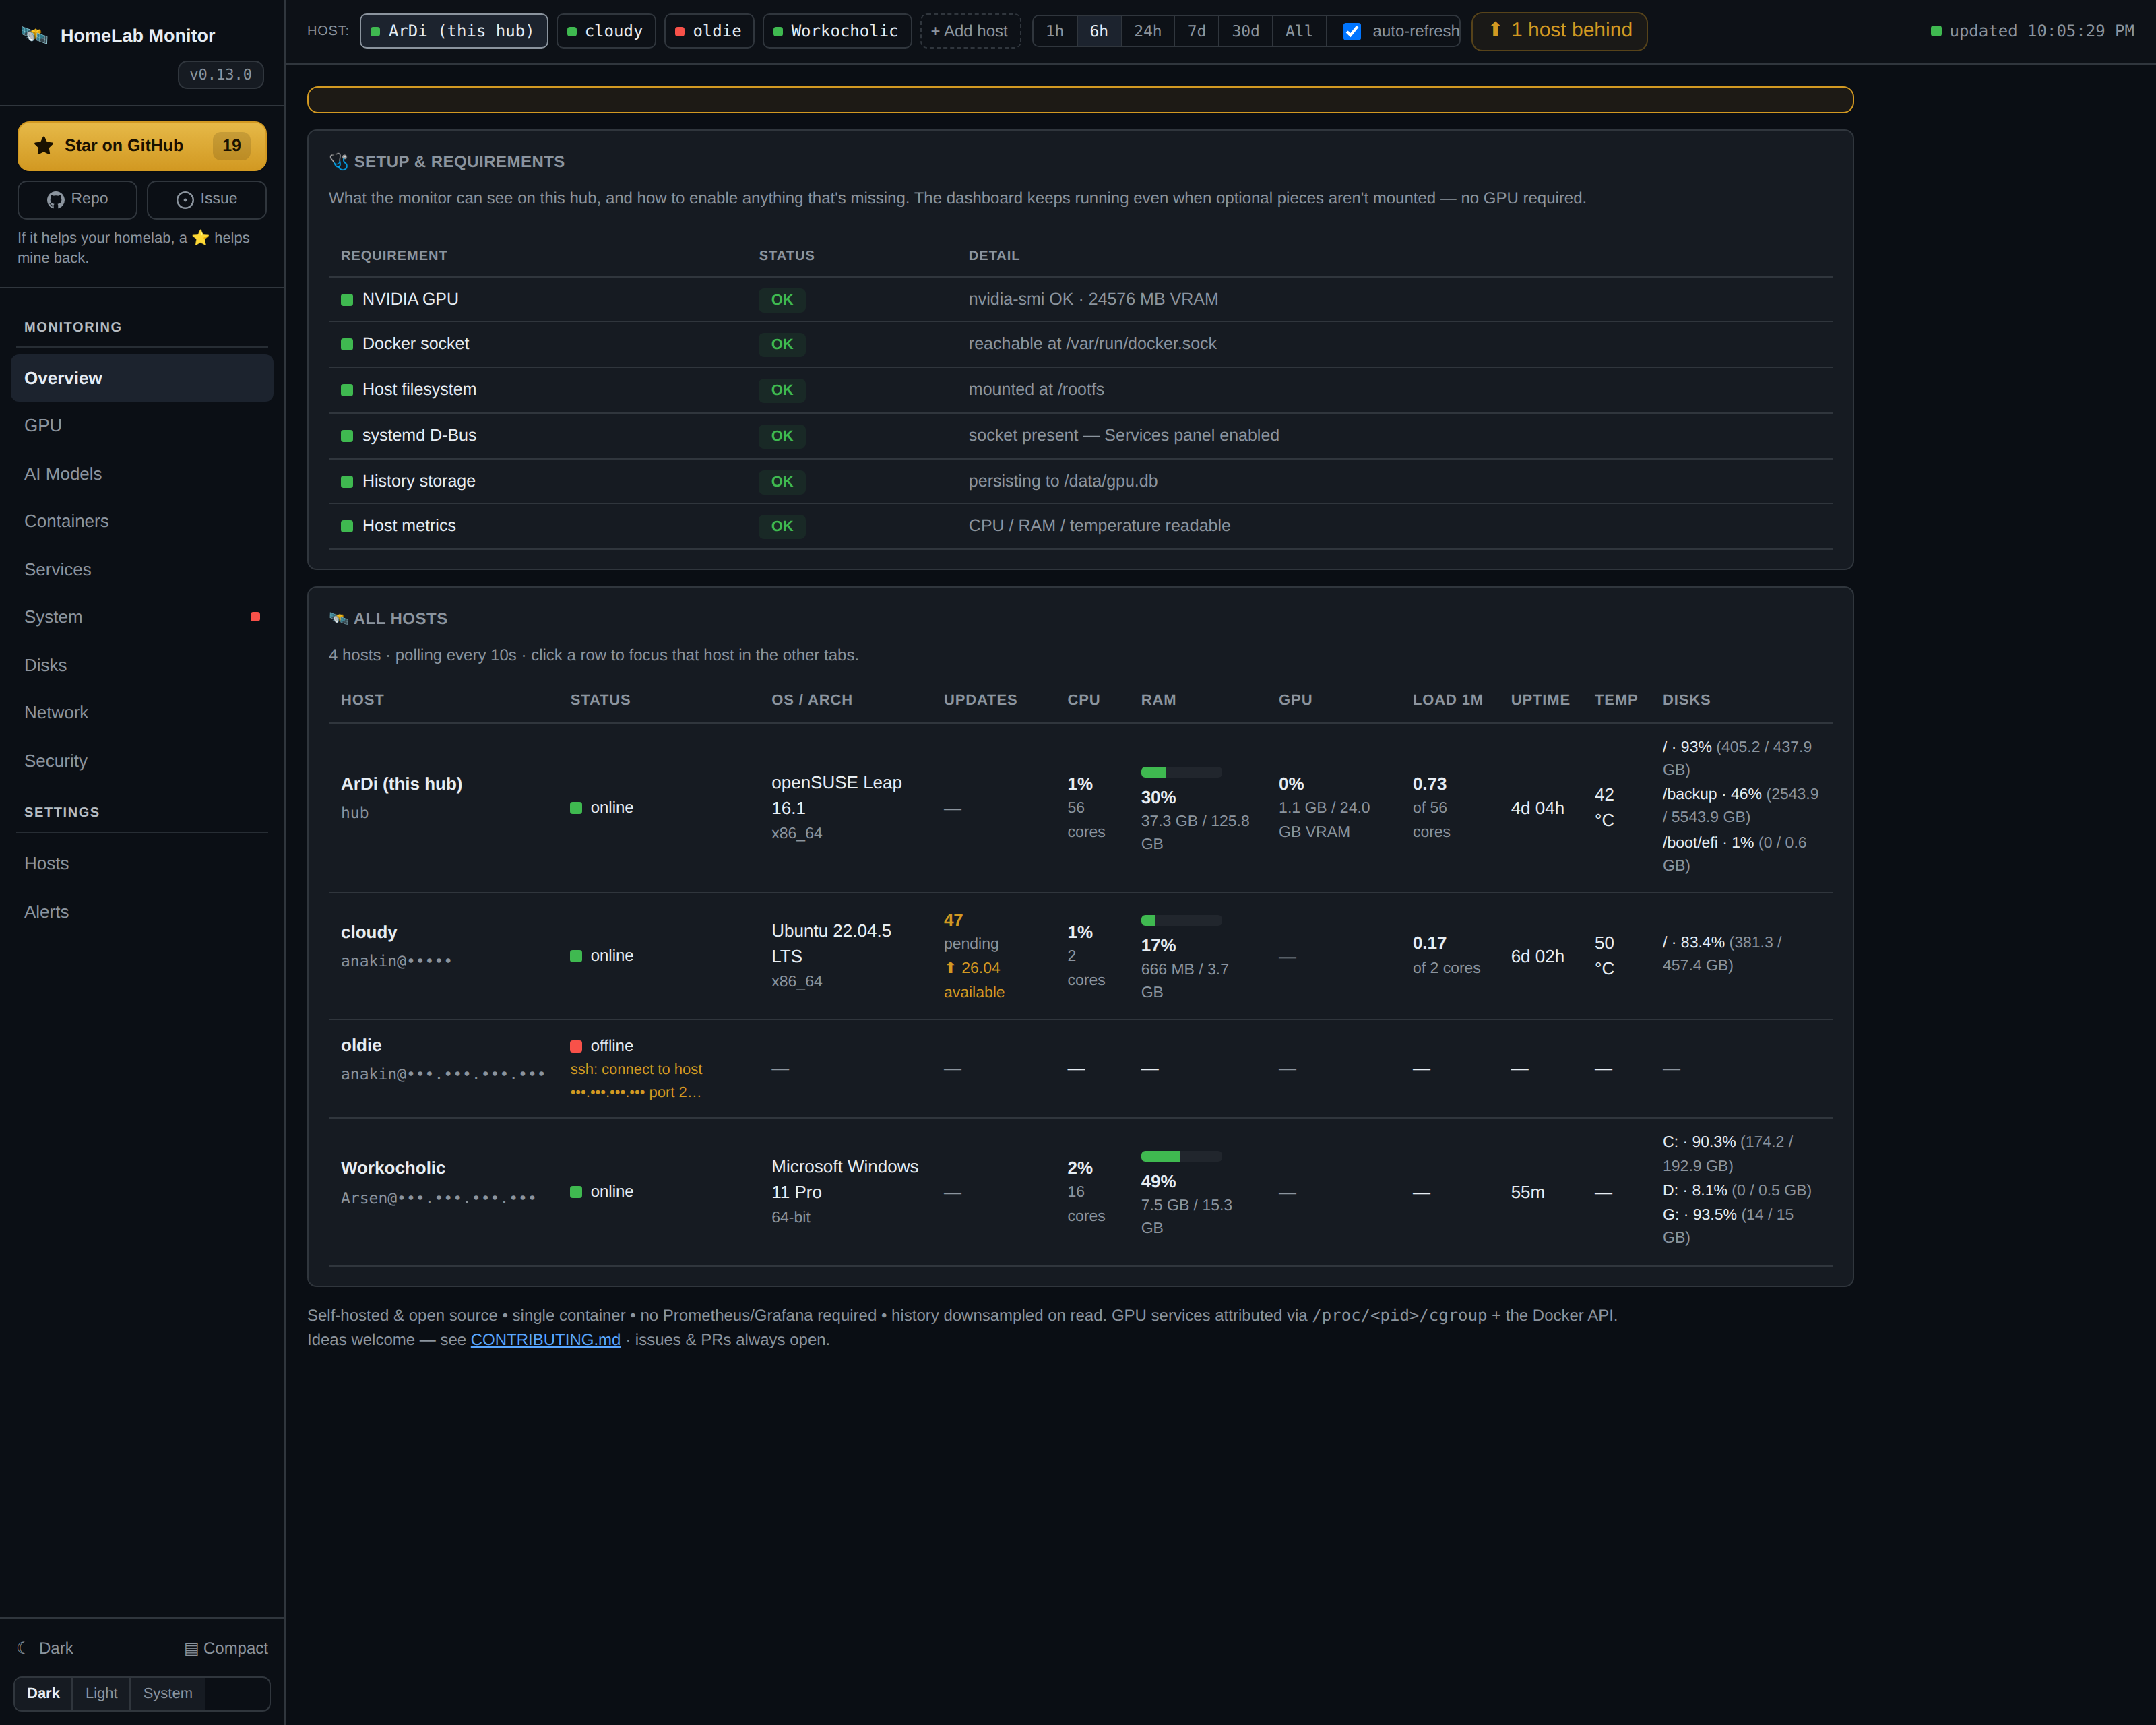
Overview
Every registered host side by side: CPU % + cores, RAM % + GB, GPU util + VRAM, load, uptime, temperature and disks. Click a row to focus that host in the other tabs.
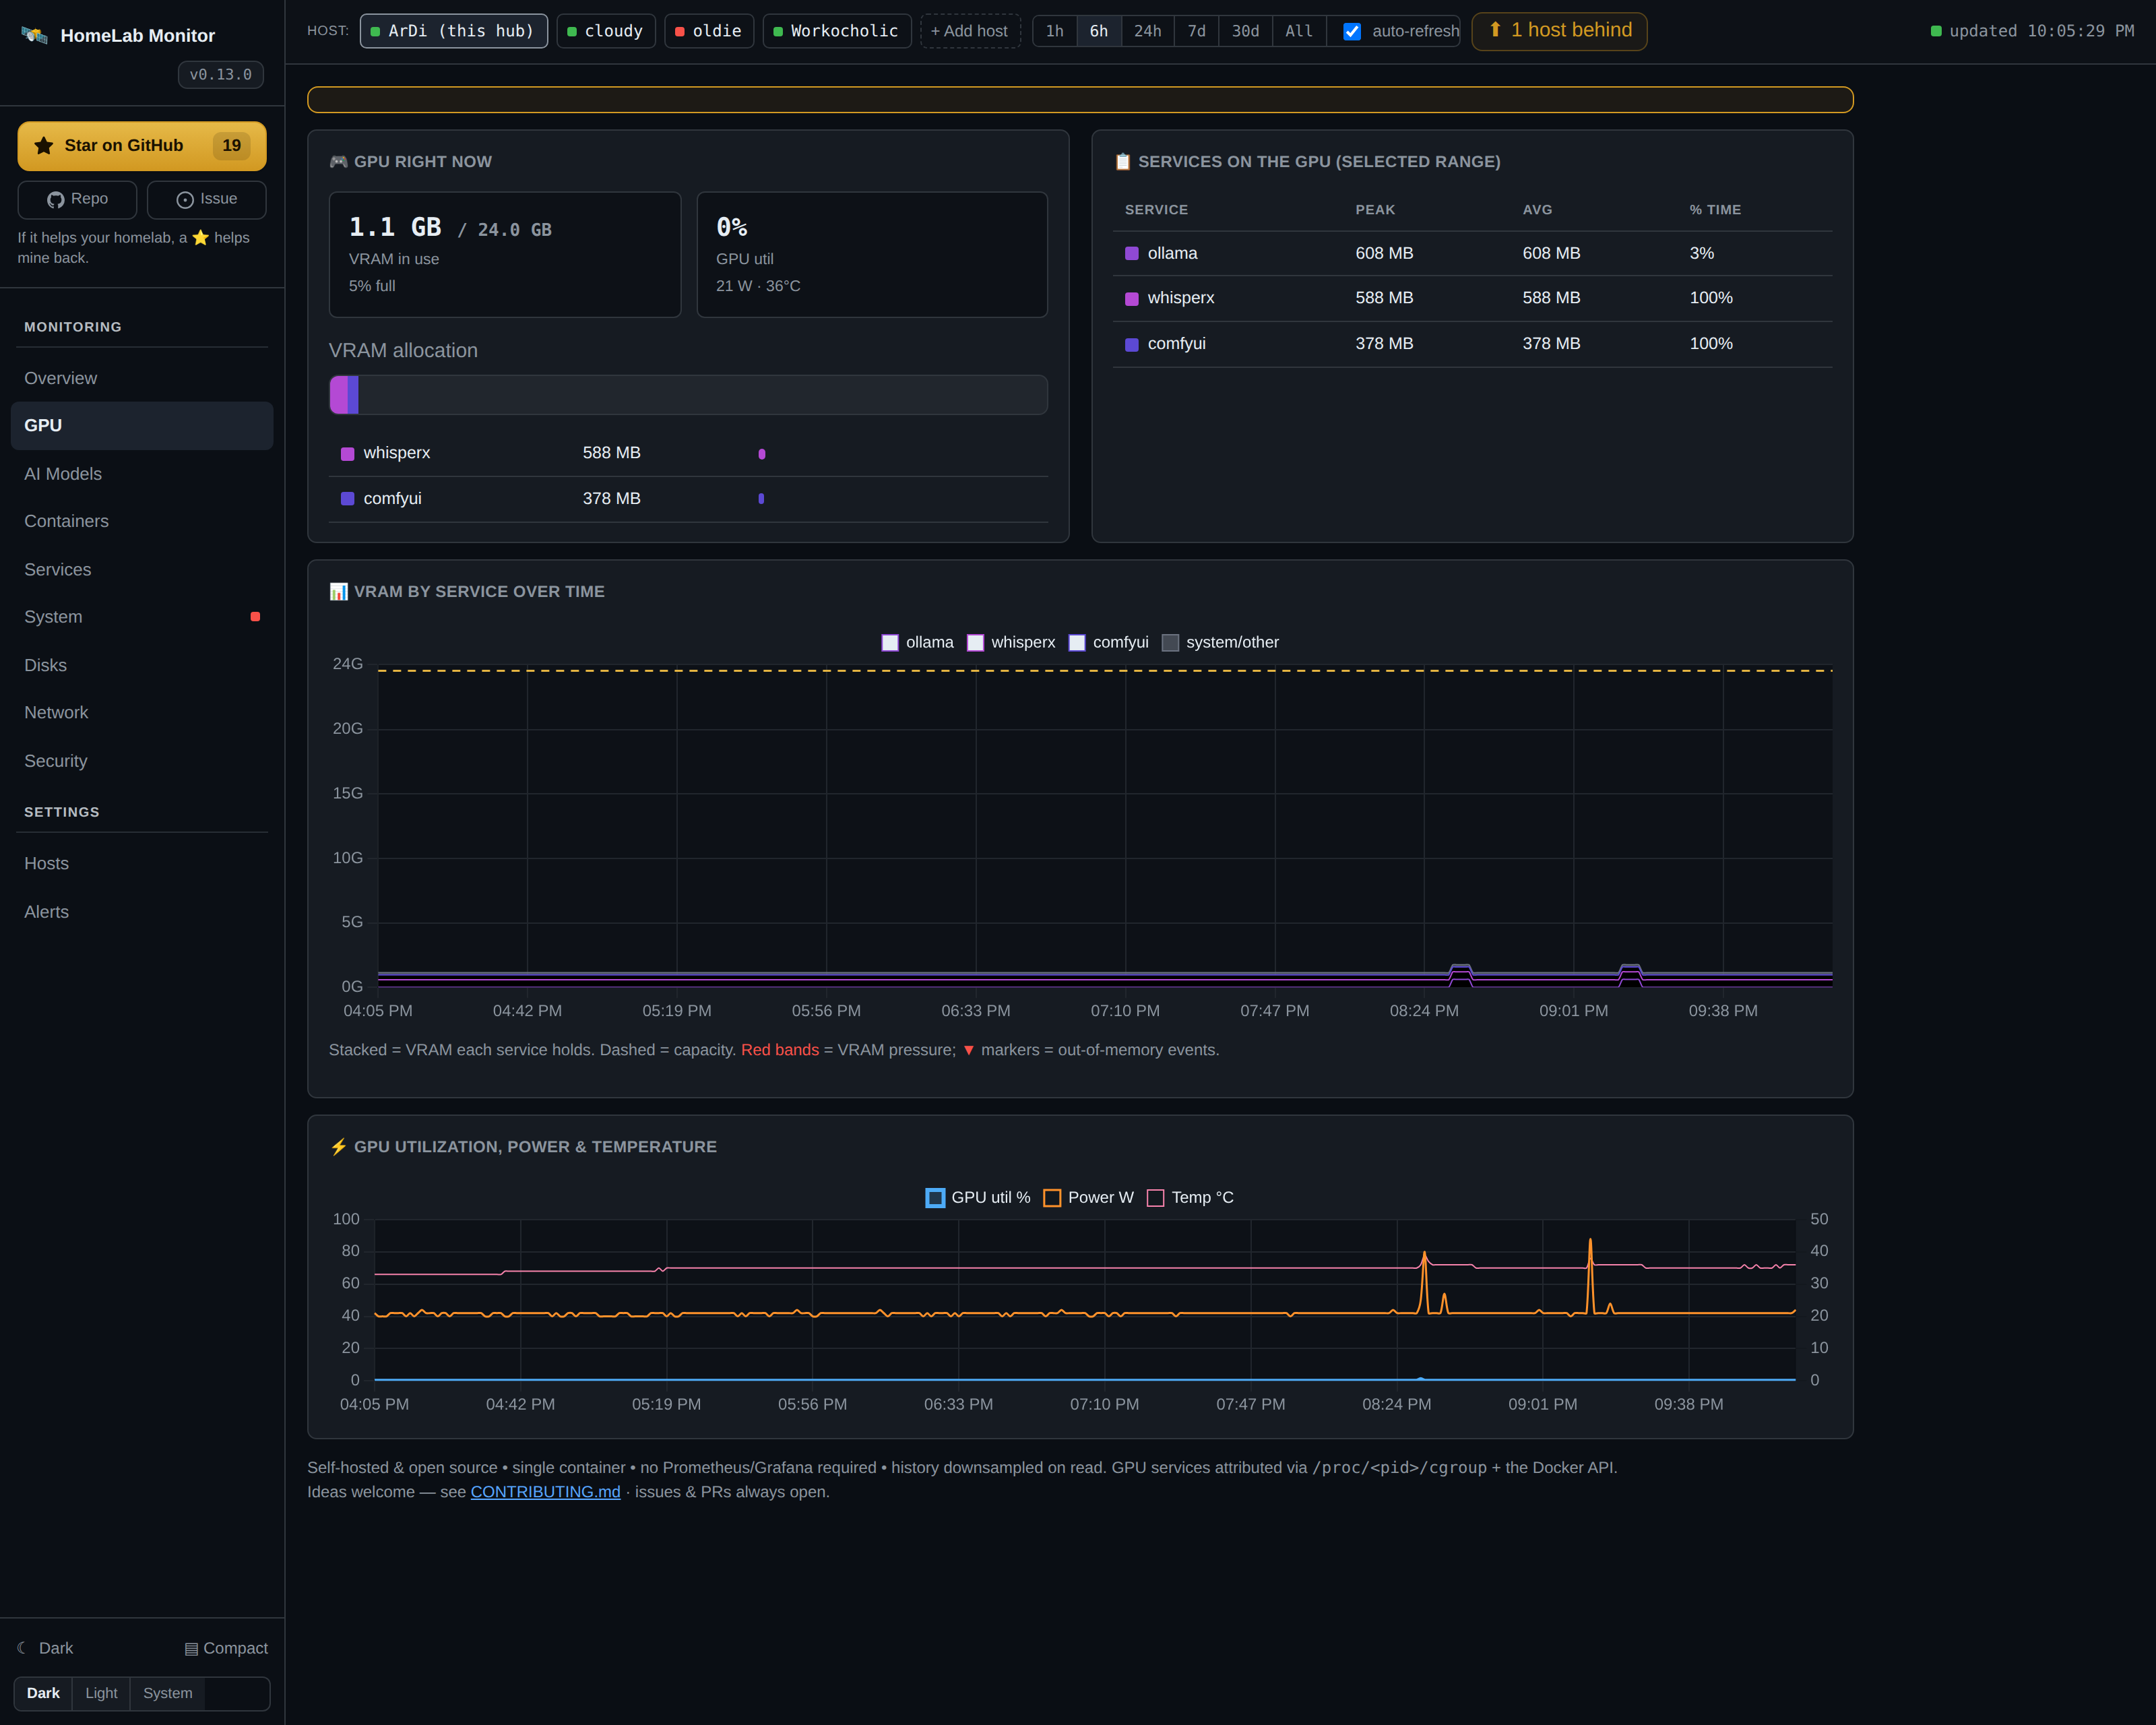
GPU
Live VRAM / utilisation / power / temperature, which container or process holds the
VRAM (mapped automatically via nvidia-smi + /proc/<pid>/cgroup — nothing
hardcoded), and a VRAM-by-service timeline.
AI Models
Every recognised model server (Ollama, vLLM, llama.cpp, ComfyUI, faster-whisper, Stable Diffusion, …), which model is loaded and its VRAM — read live from the server's own API. Servers stay listed as Idle when their model unloads (nothing flickers away), and a "Driven by" breakdown shows which services are calling each server. See the full list of 30+ servers.
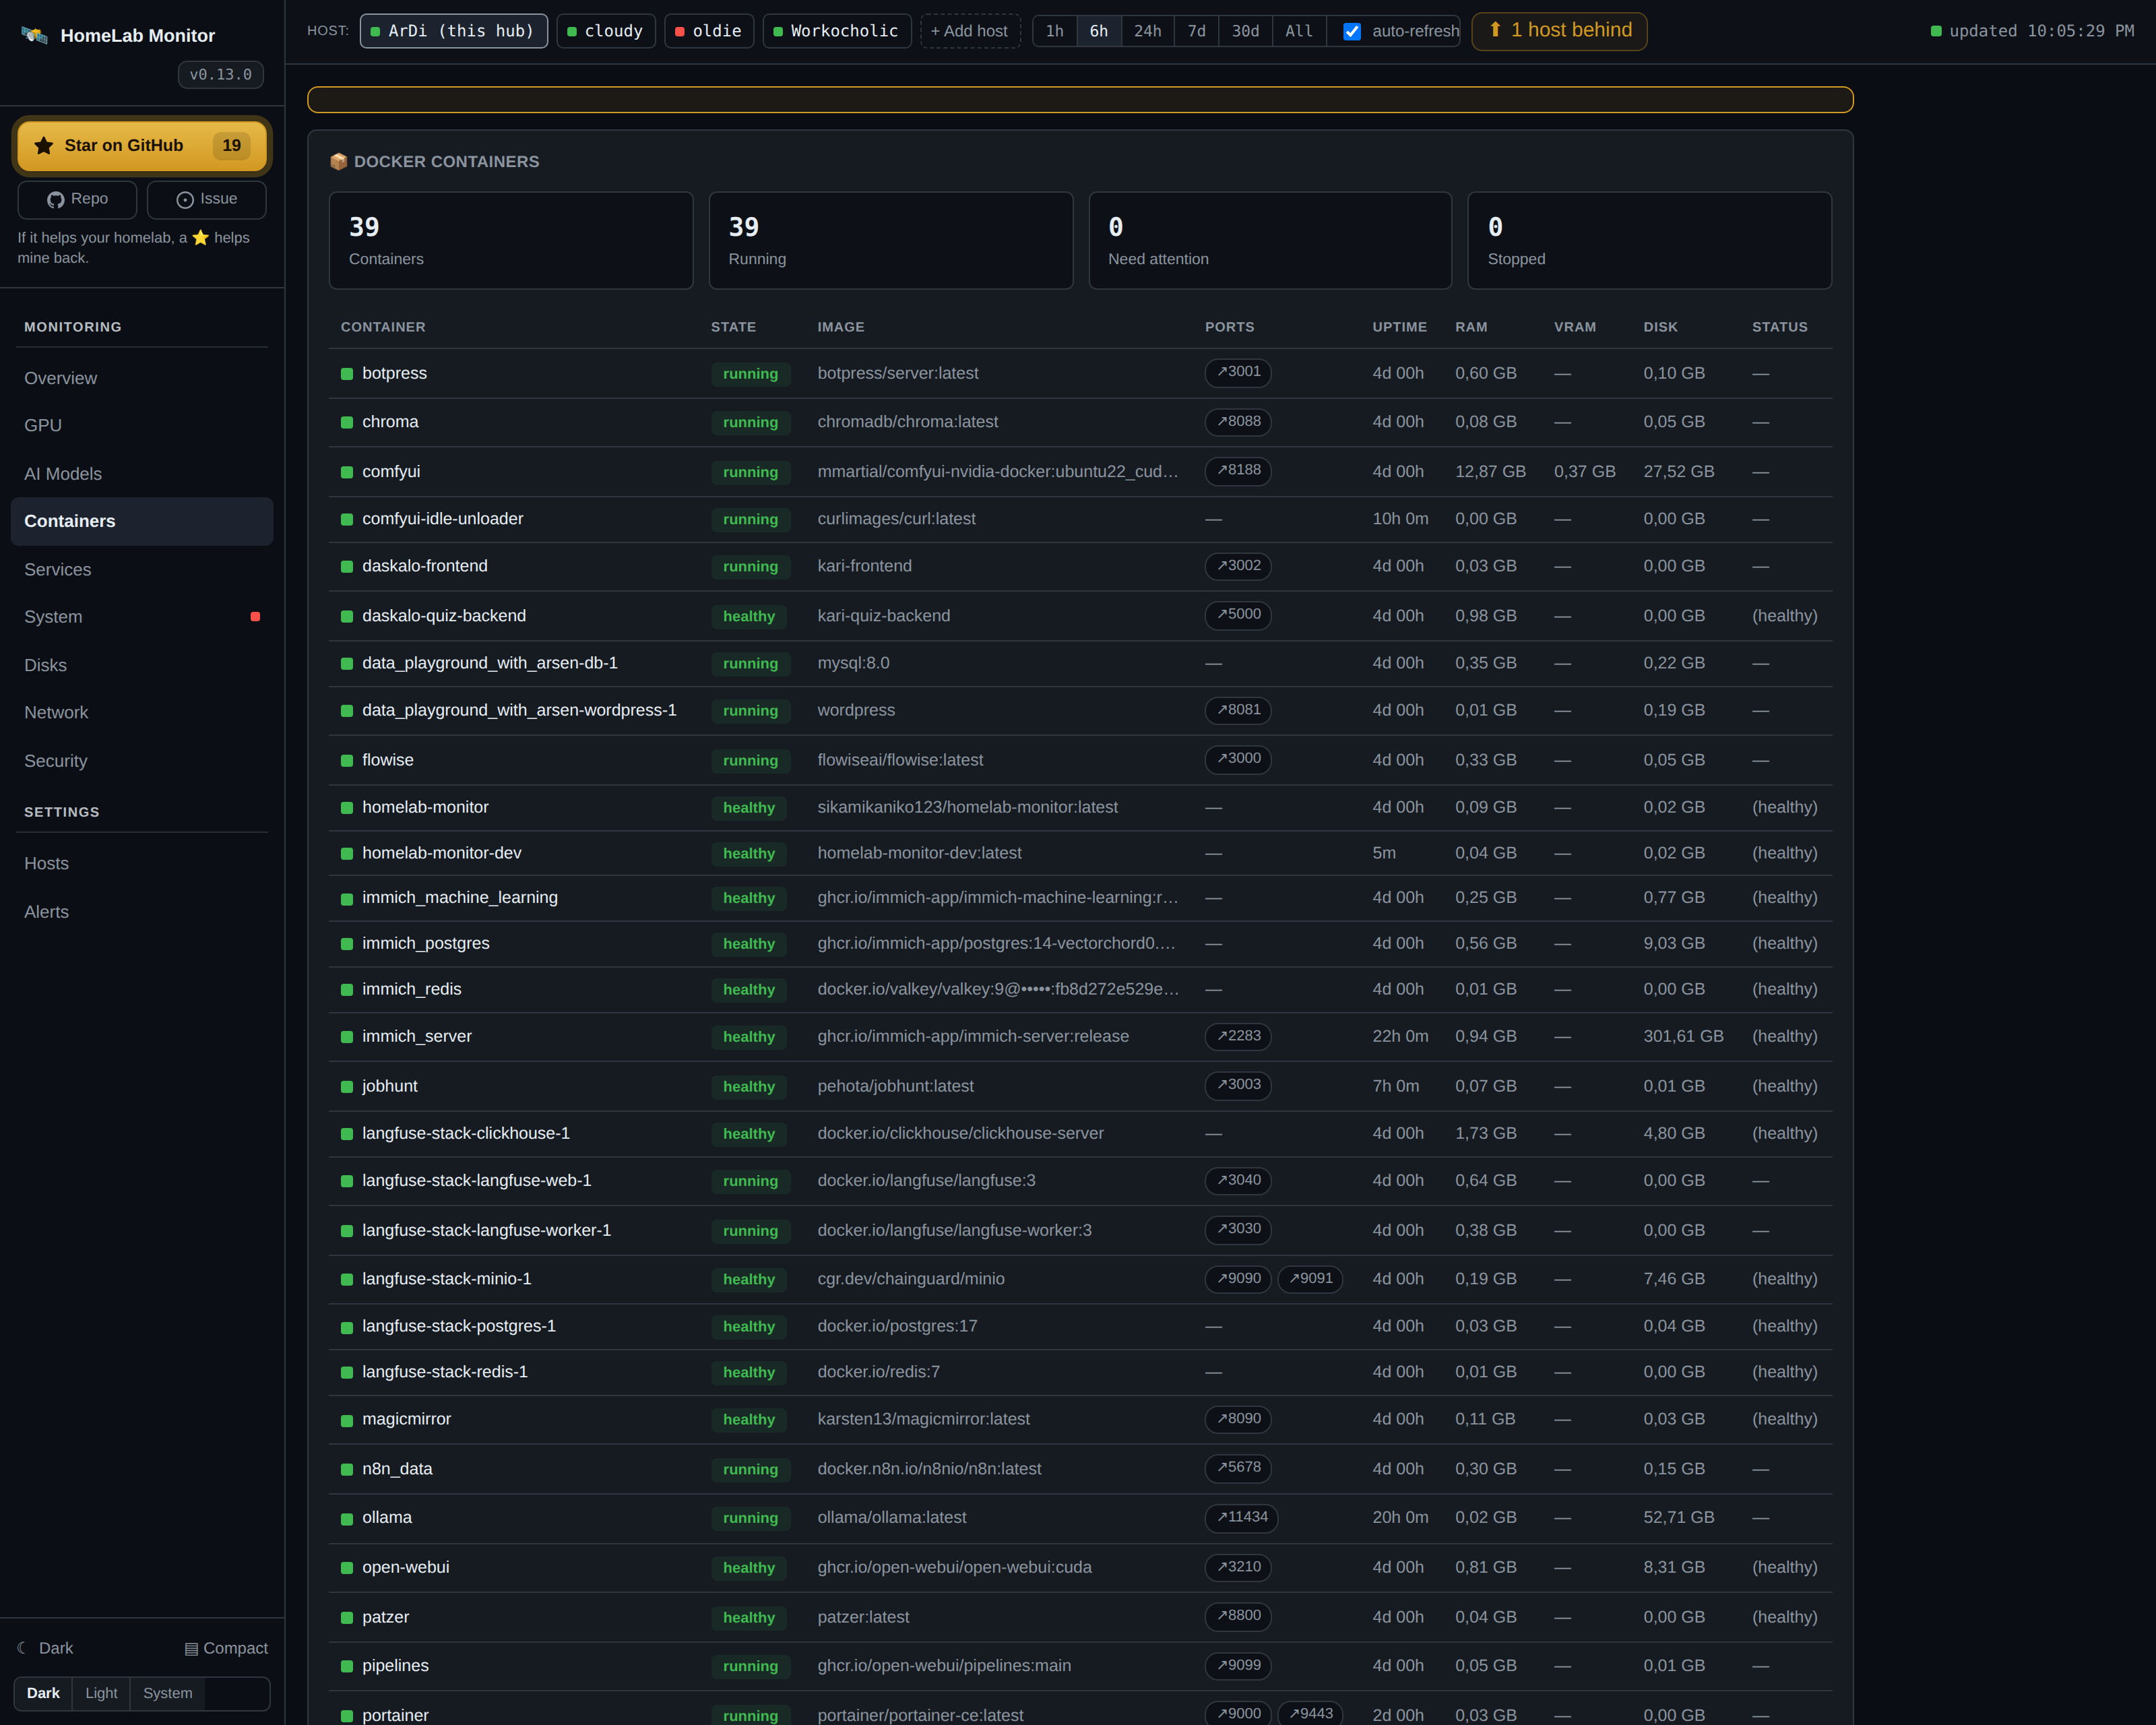
Containers
Health of every Docker container with uptime, RAM and GPU-VRAM in separate
columns (RAM is the real resident set — page cache excluded — so the numbers add
up), real on-disk footprint, a table total, and clickable port chips that open
host:port in a new tab. Start, stop, restart and change the restart policy of
local containers straight from the table — on by default, see
ENABLE_CONTROLS
to turn it off.
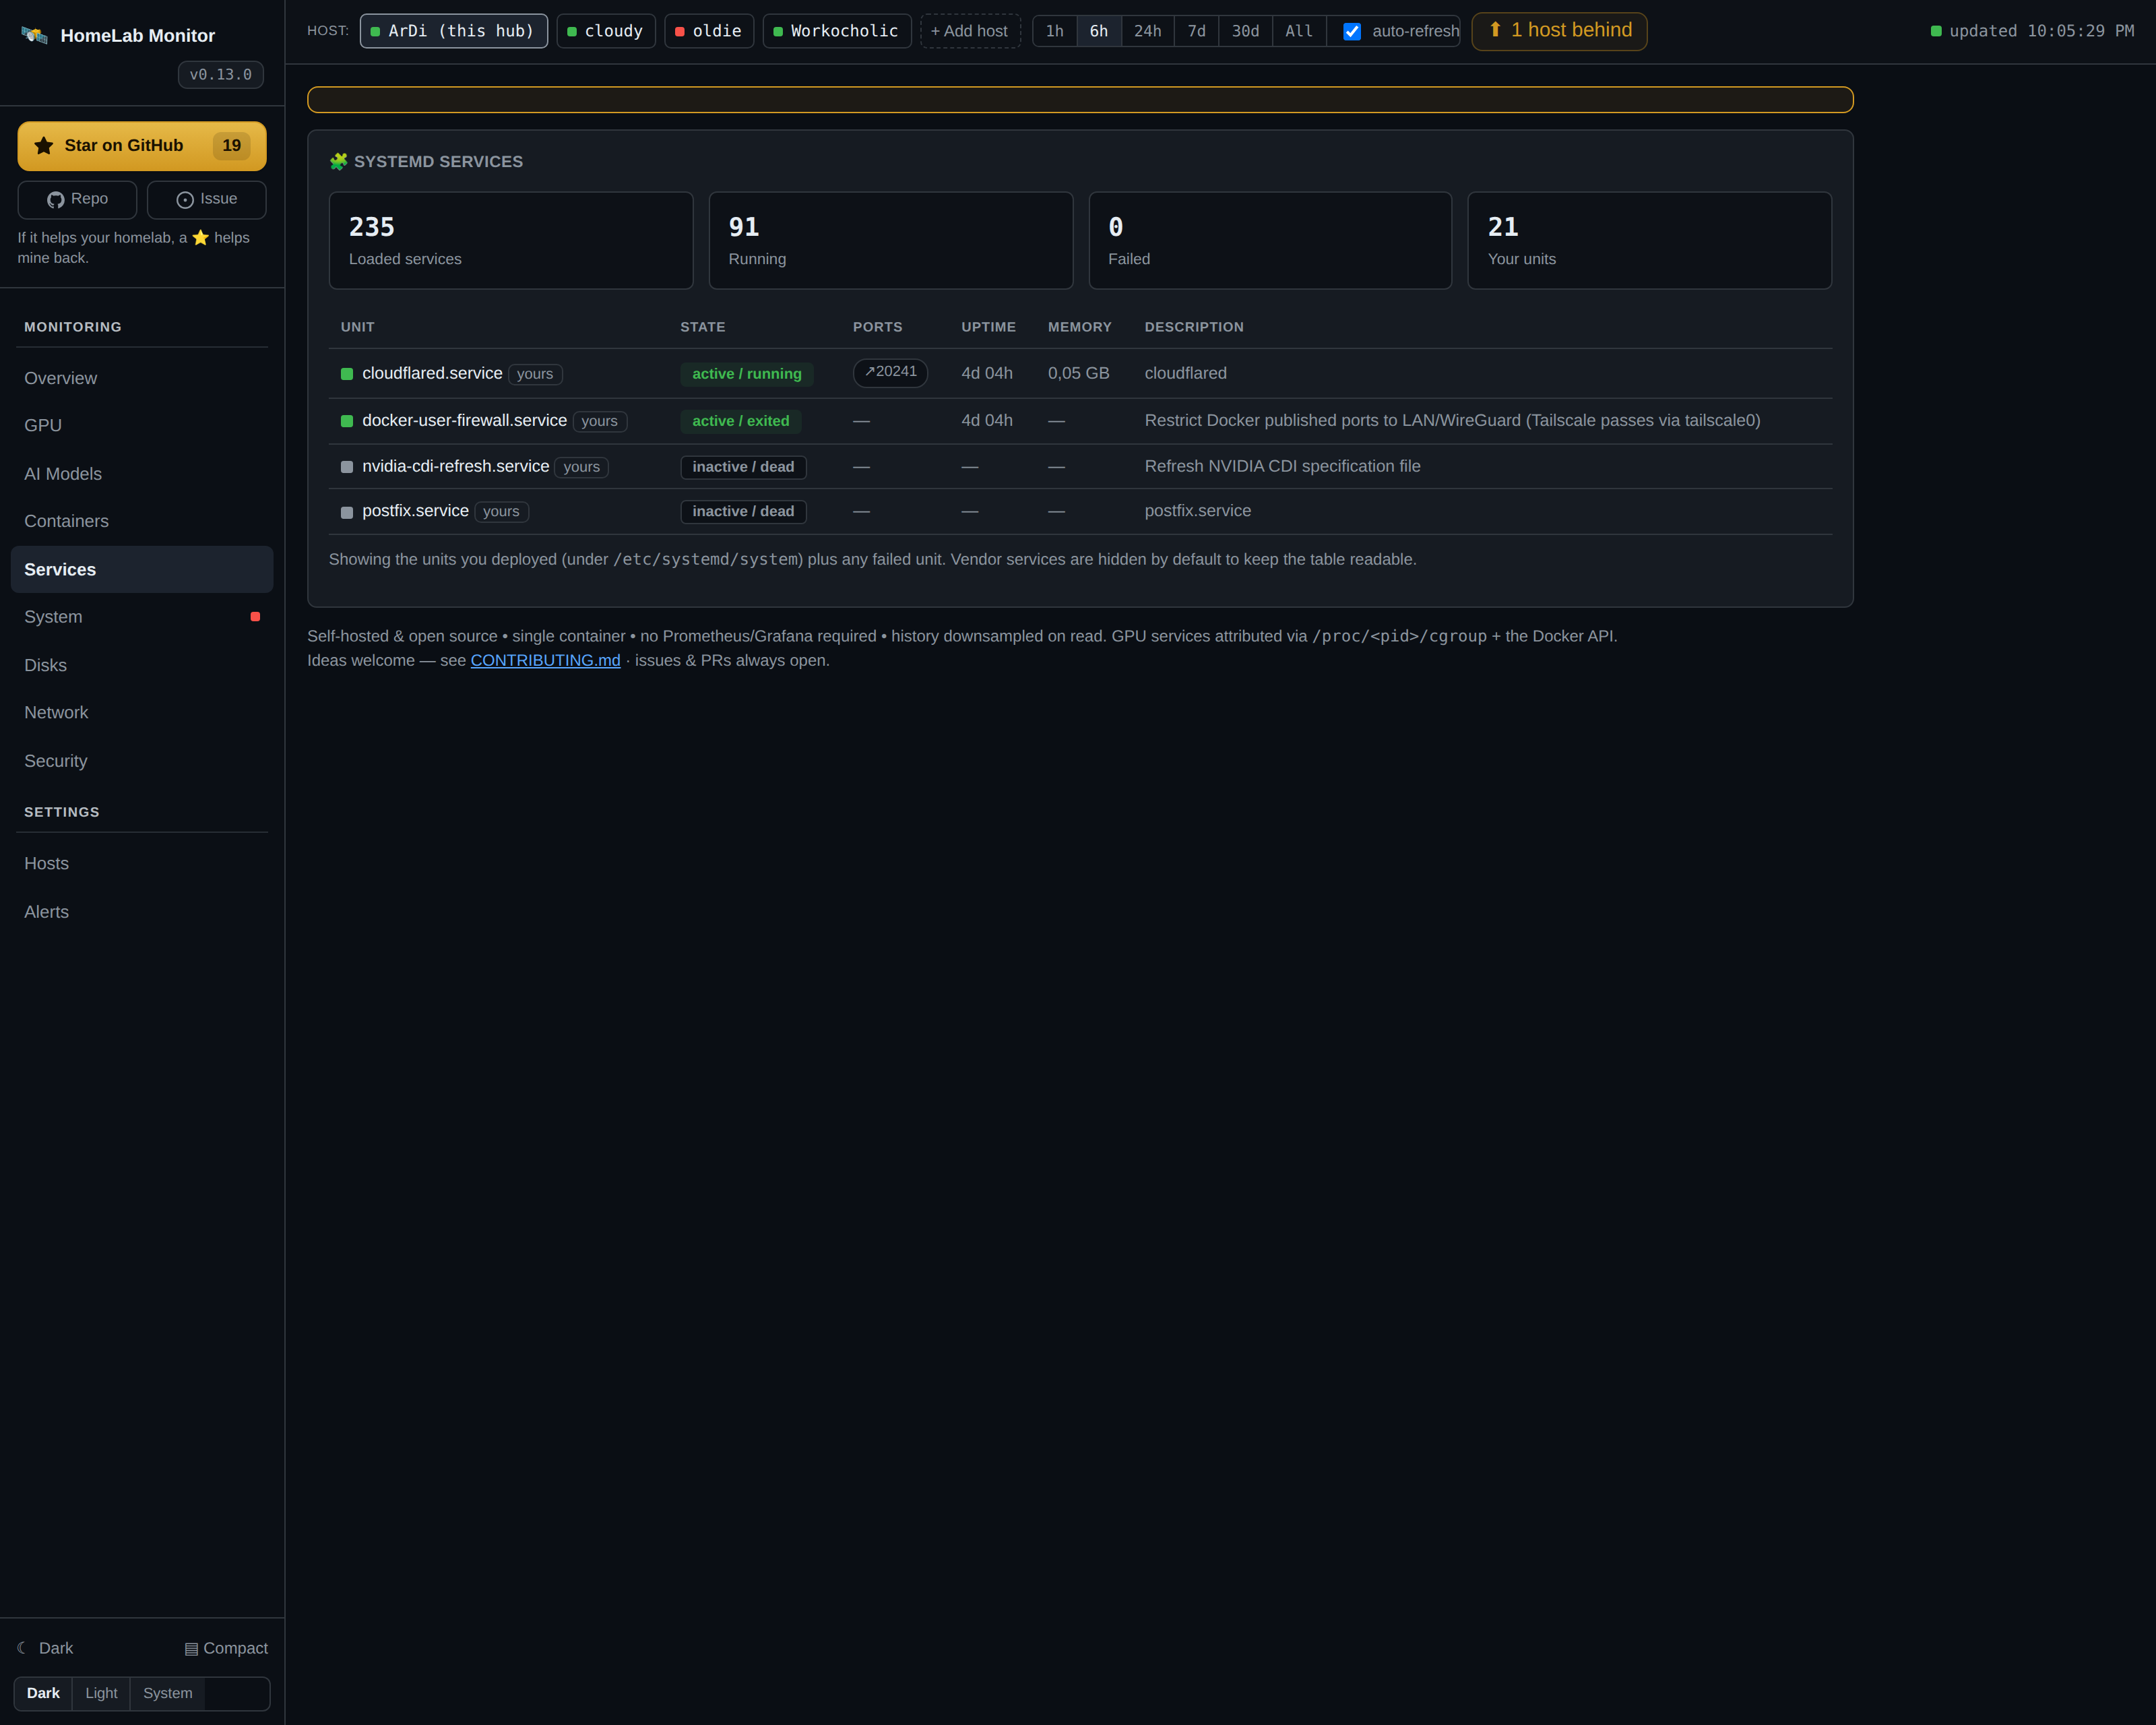
Services
systemd service health for the active host (local or remote), with the units
you deployed highlighted, any failed unit surfaced first, plus per-unit uptime,
memory, and listen ports. Start/stop/restart is on by default too — for the
local host and for any registered remote (Linux or Windows) — see
ENABLE_CONTROLS
to turn it off.
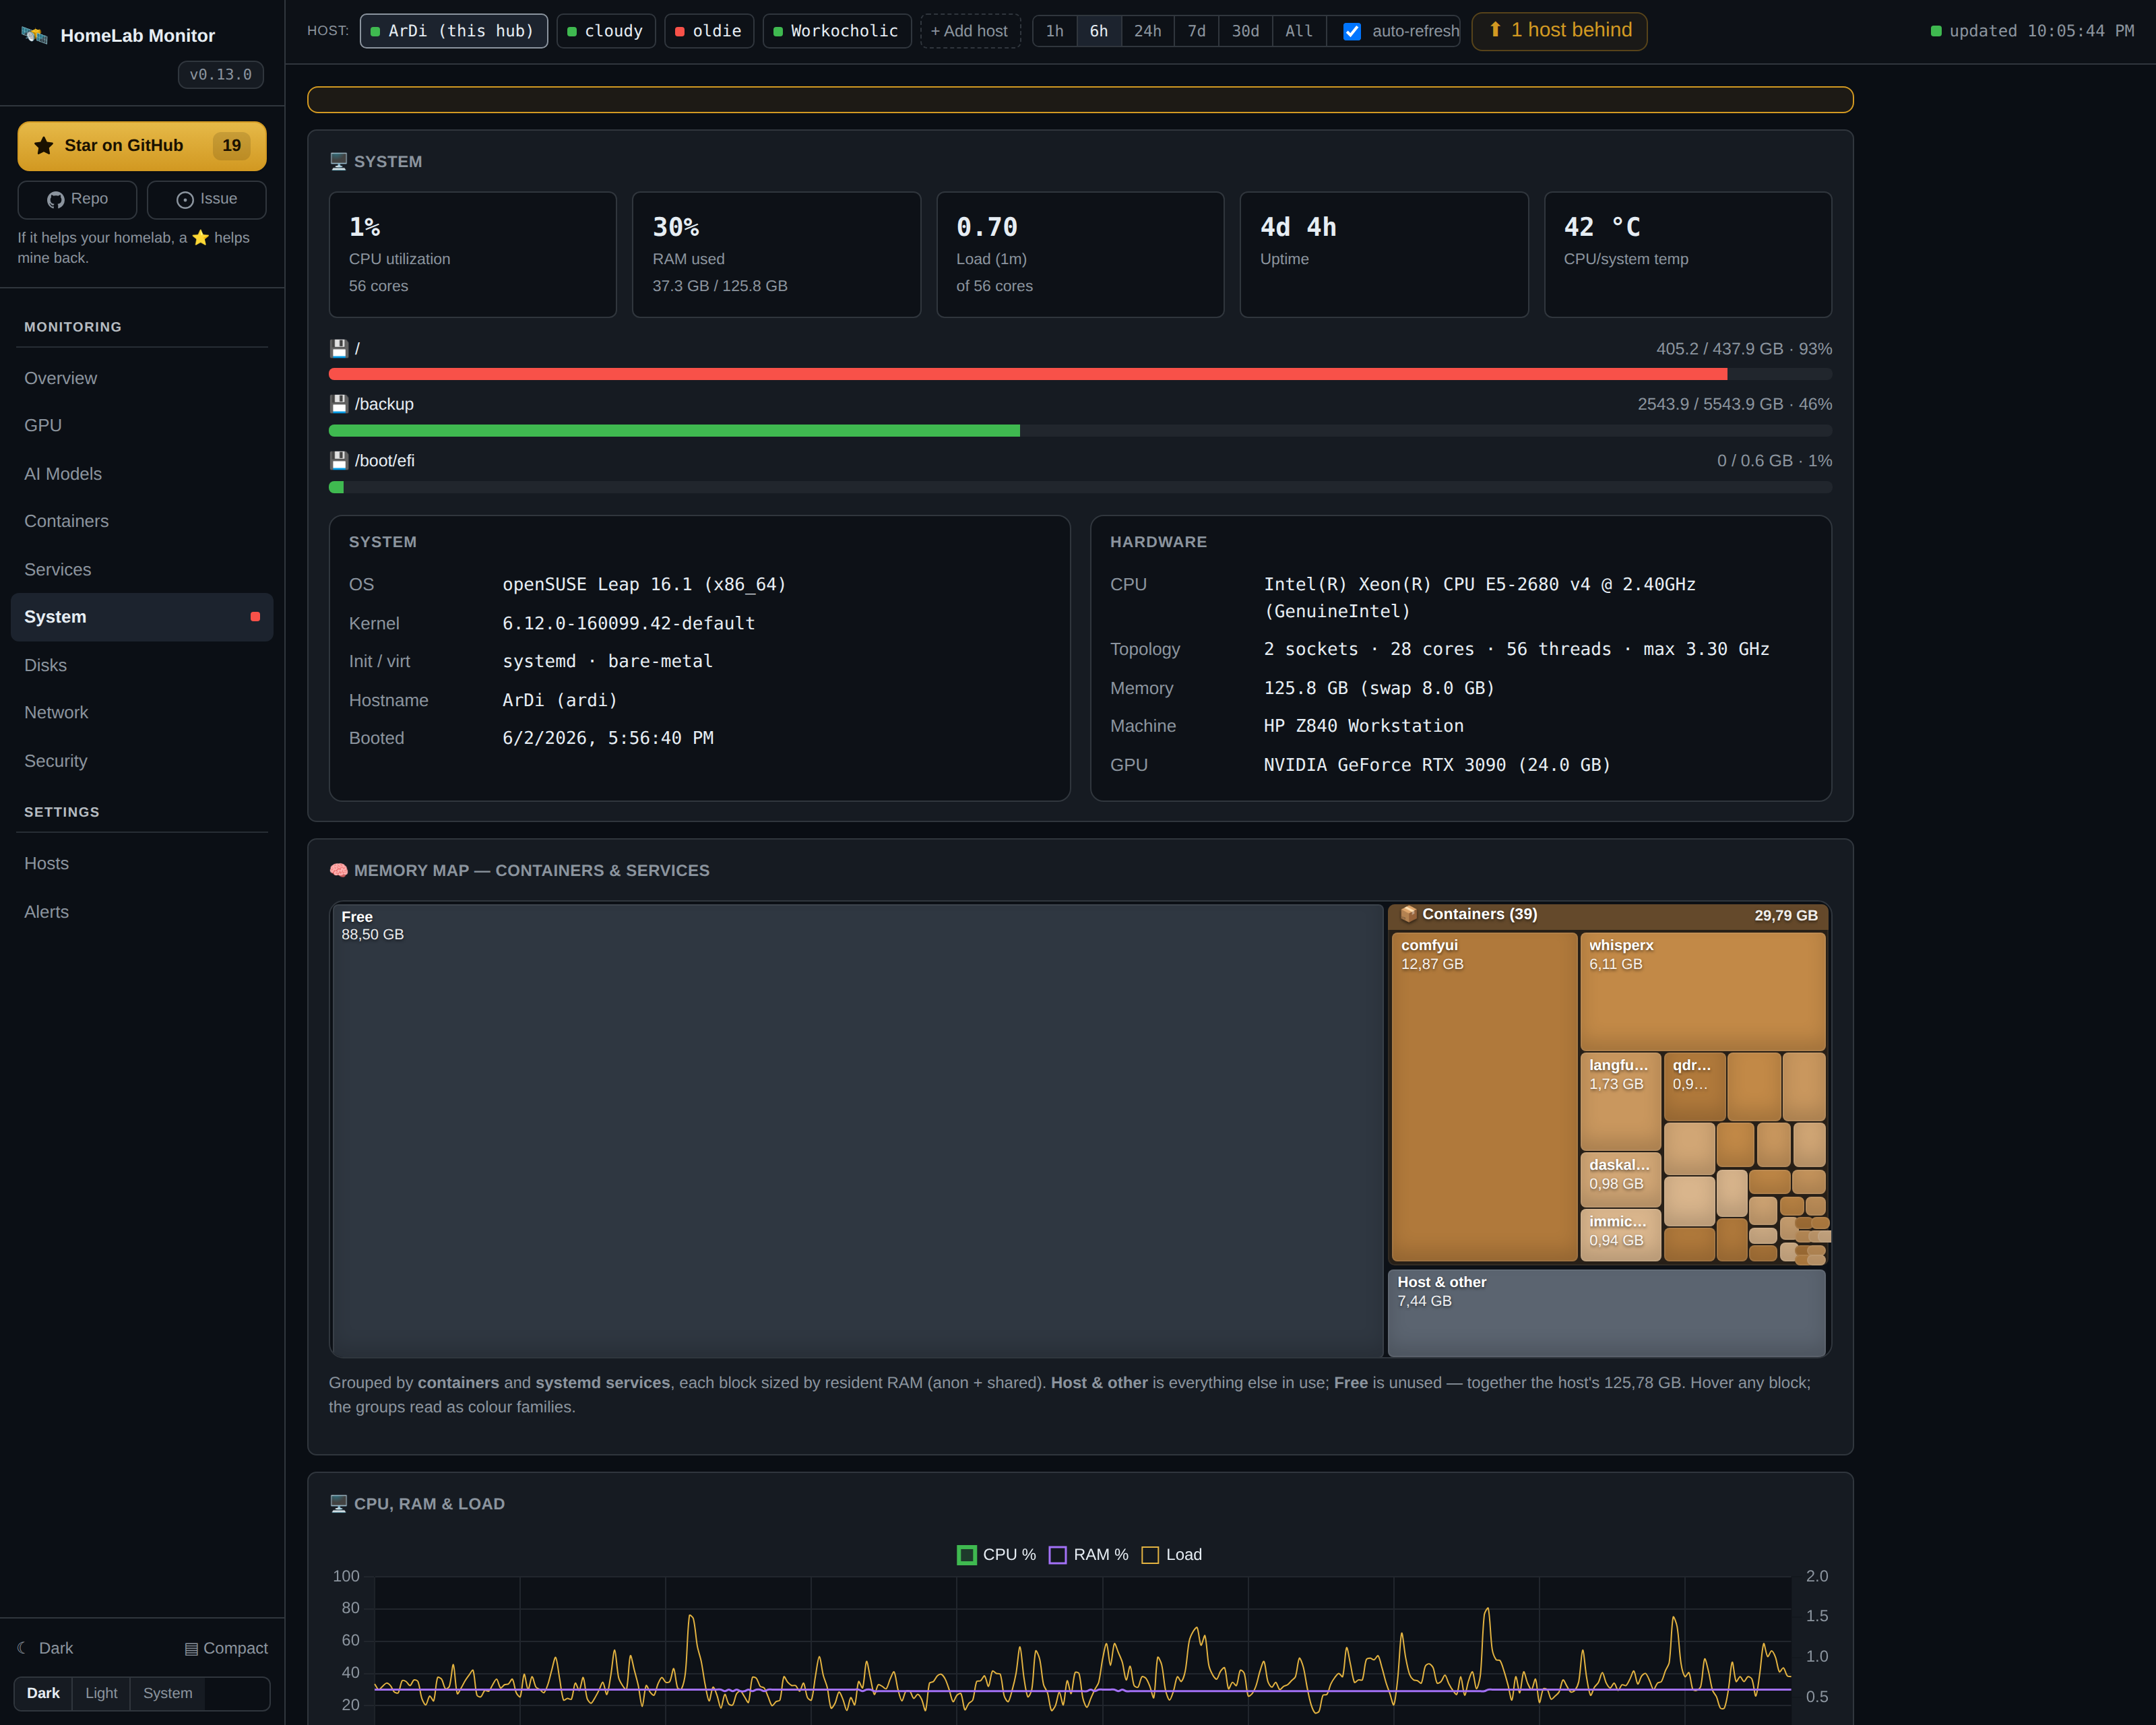
System
CPU, RAM, load, uptime, temperature and disk usage, plus a full inventory panel: OS + version, kernel, architecture, init system, bare-metal/VM detection, machine model, CPU model & topology, and GPU. A Memory map treemap shows exactly what's using RAM — grouped by container and by systemd service — so it's useful even on a box with no Docker.
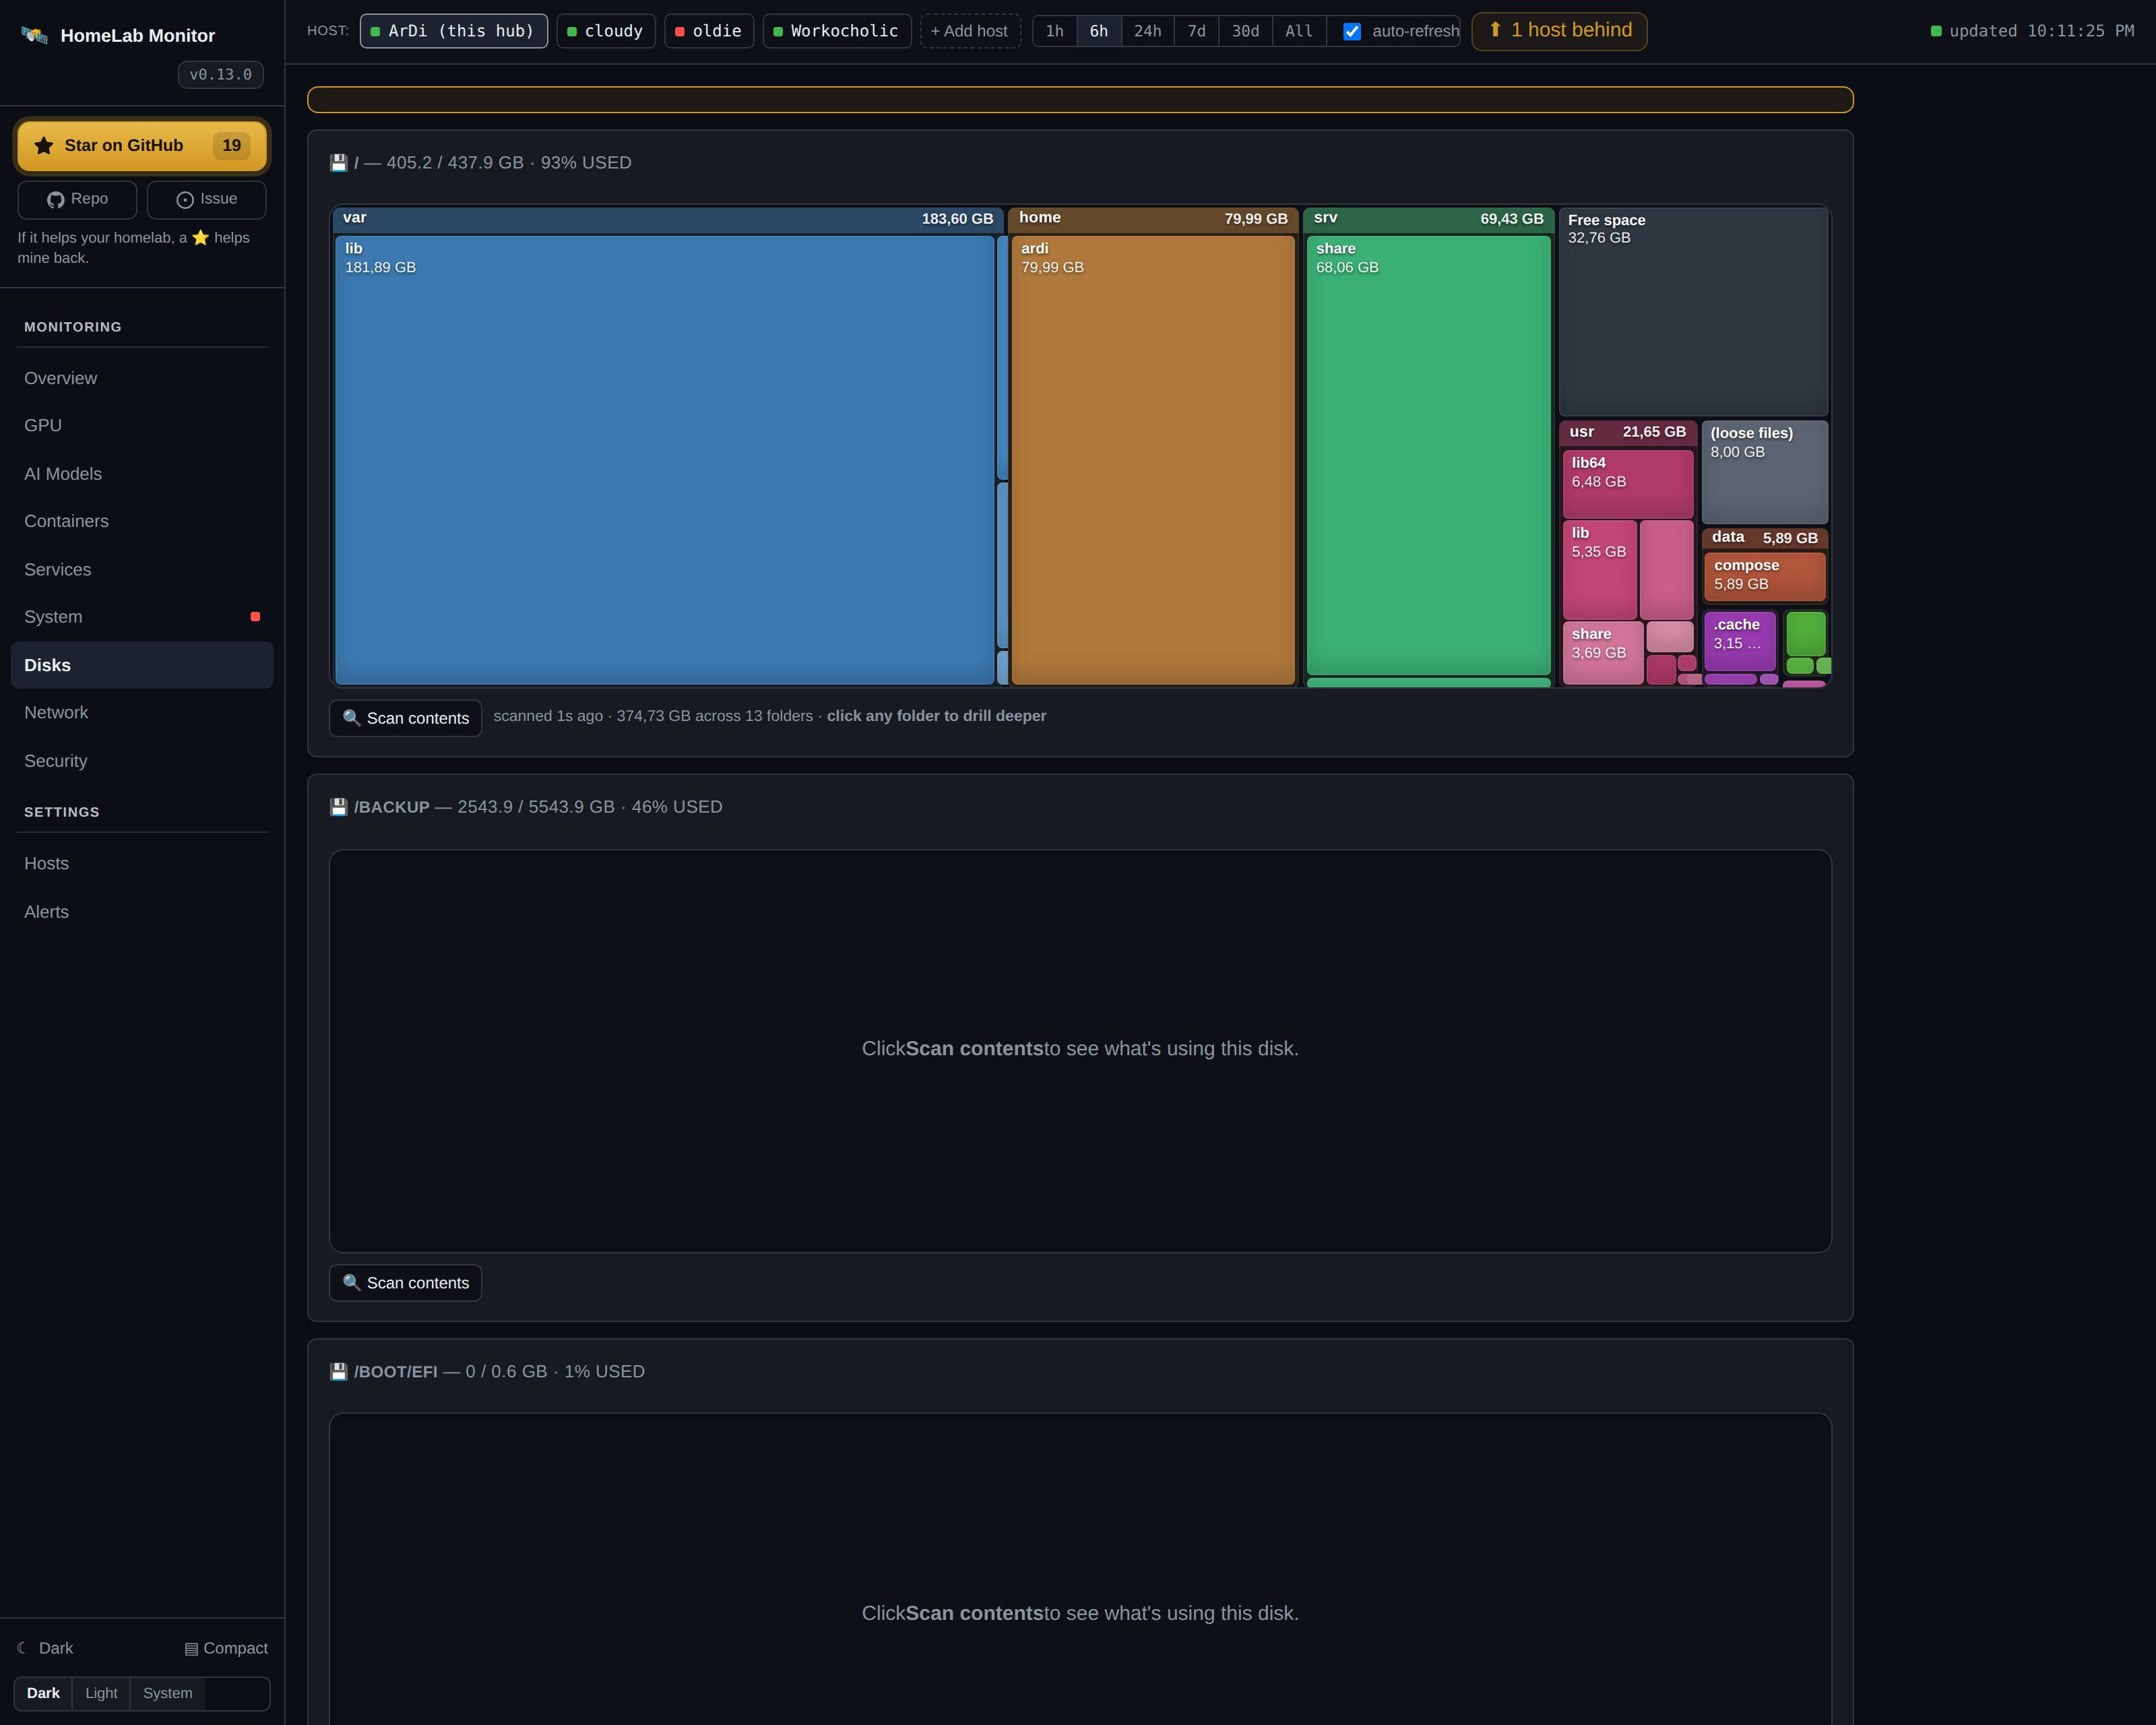
Disks
A WizTree-style treemap per filesystem: scan a disk and see what's eating the space as nested rectangles (top folders and their sub-folders in one view), then click any folder to drill deeper. On-demand and cached, so it never hammers your disks in the background.
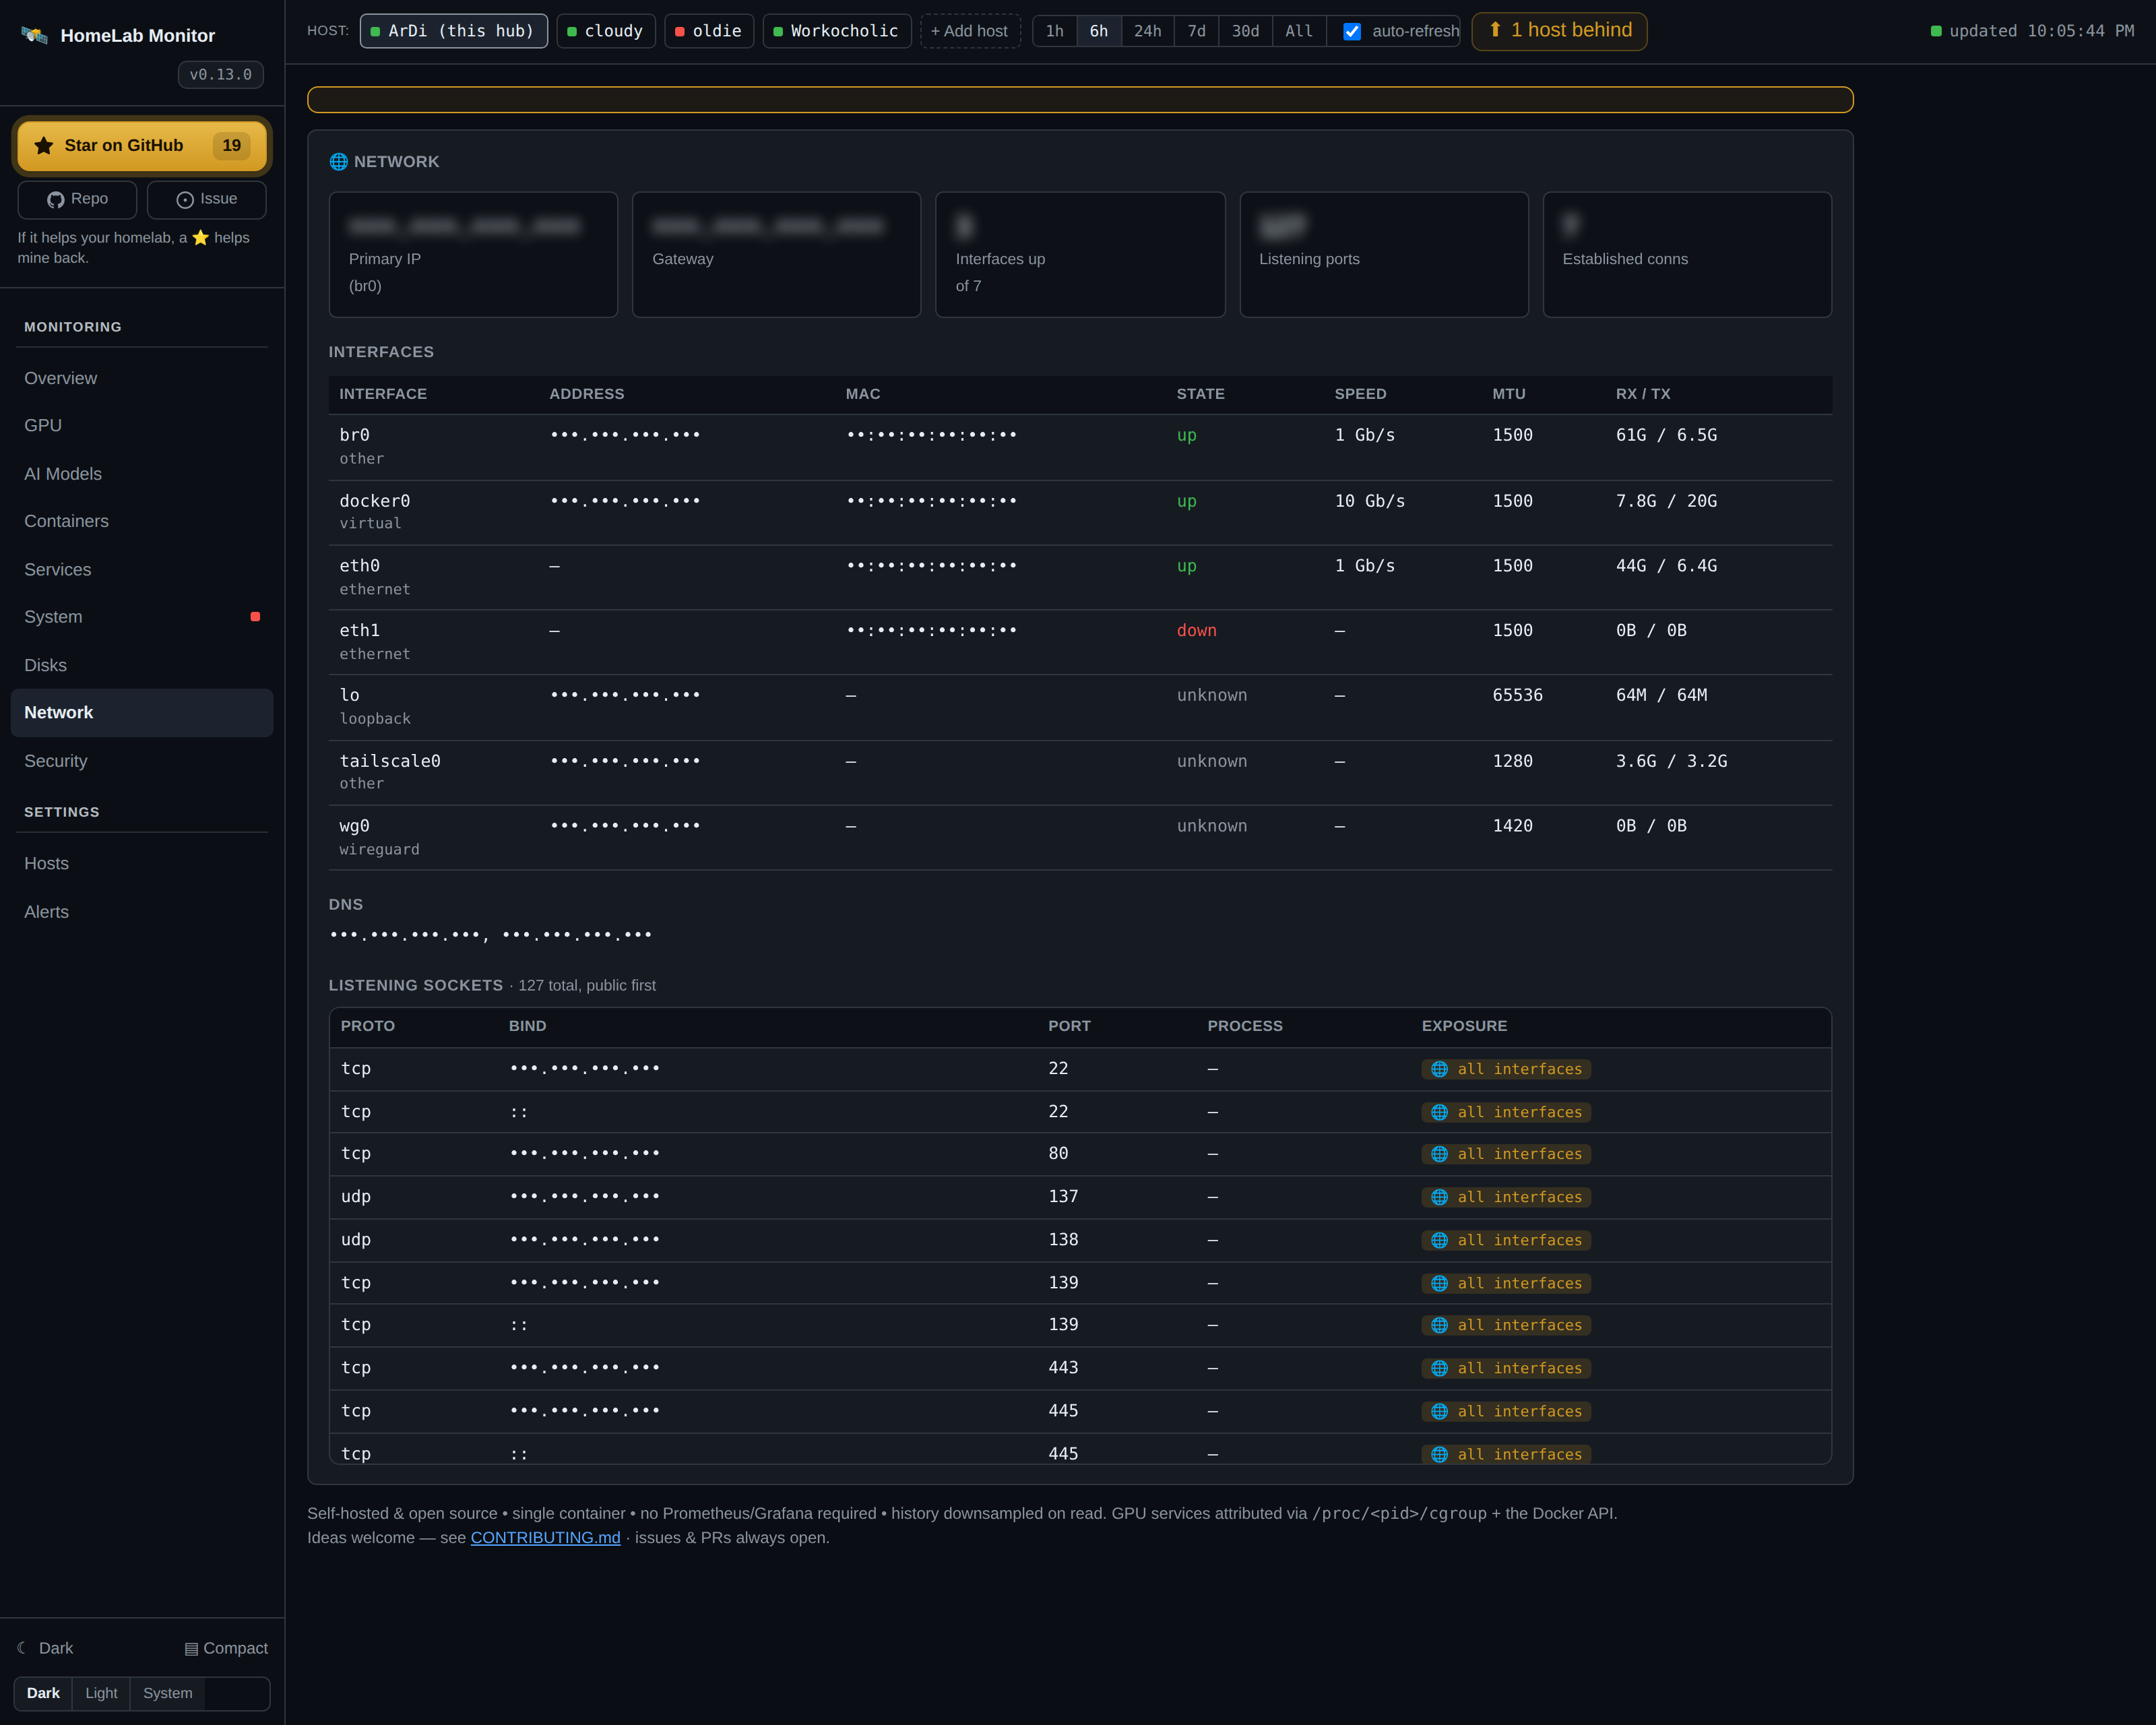
Network
Per-host interfaces (IPv4/IPv6, MAC, link state, speed, MTU, RX/TX), default gateway, DNS resolvers, and a listening-socket table that flags which ports are bound to all interfaces vs localhost.
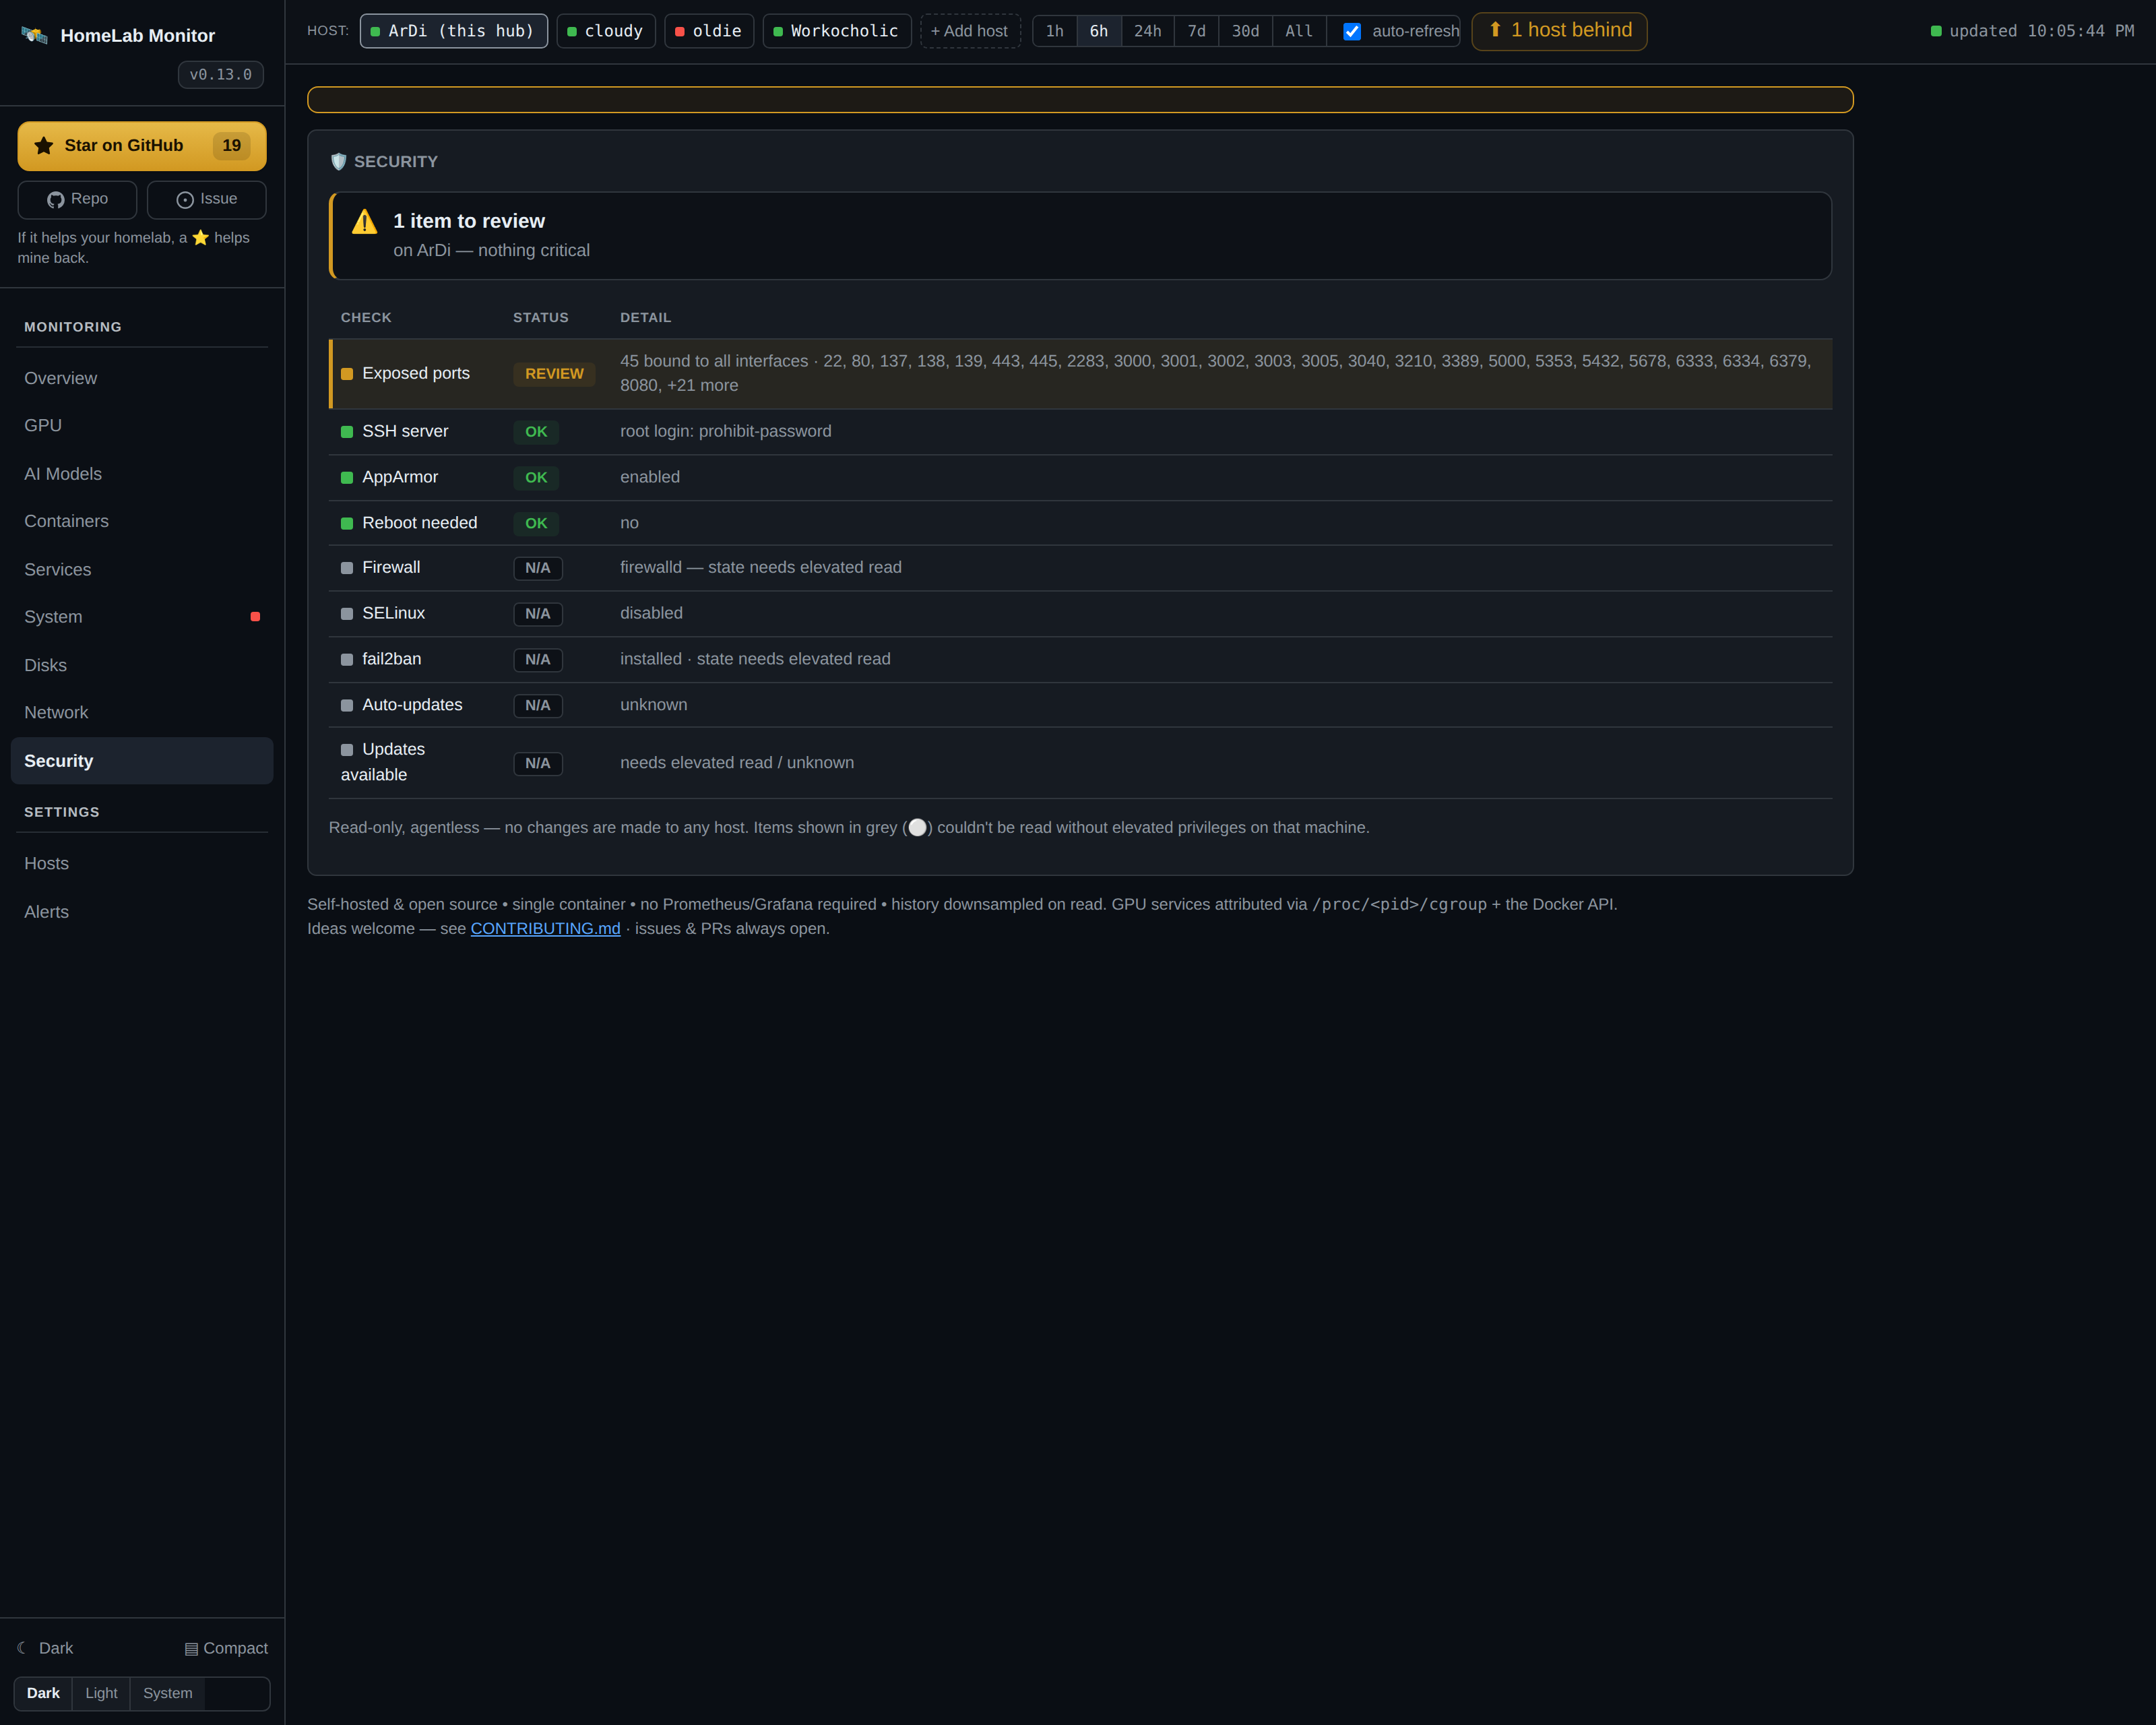
Security
A read-only posture check per host: firewall (ufw / firewalld / nftables), SSH hardening (root login / password auth), SELinux/AppArmor, fail2ban, reboot-pending and auto-updates — issues surfaced first, with anything that needs root to read marked clearly rather than guessed.
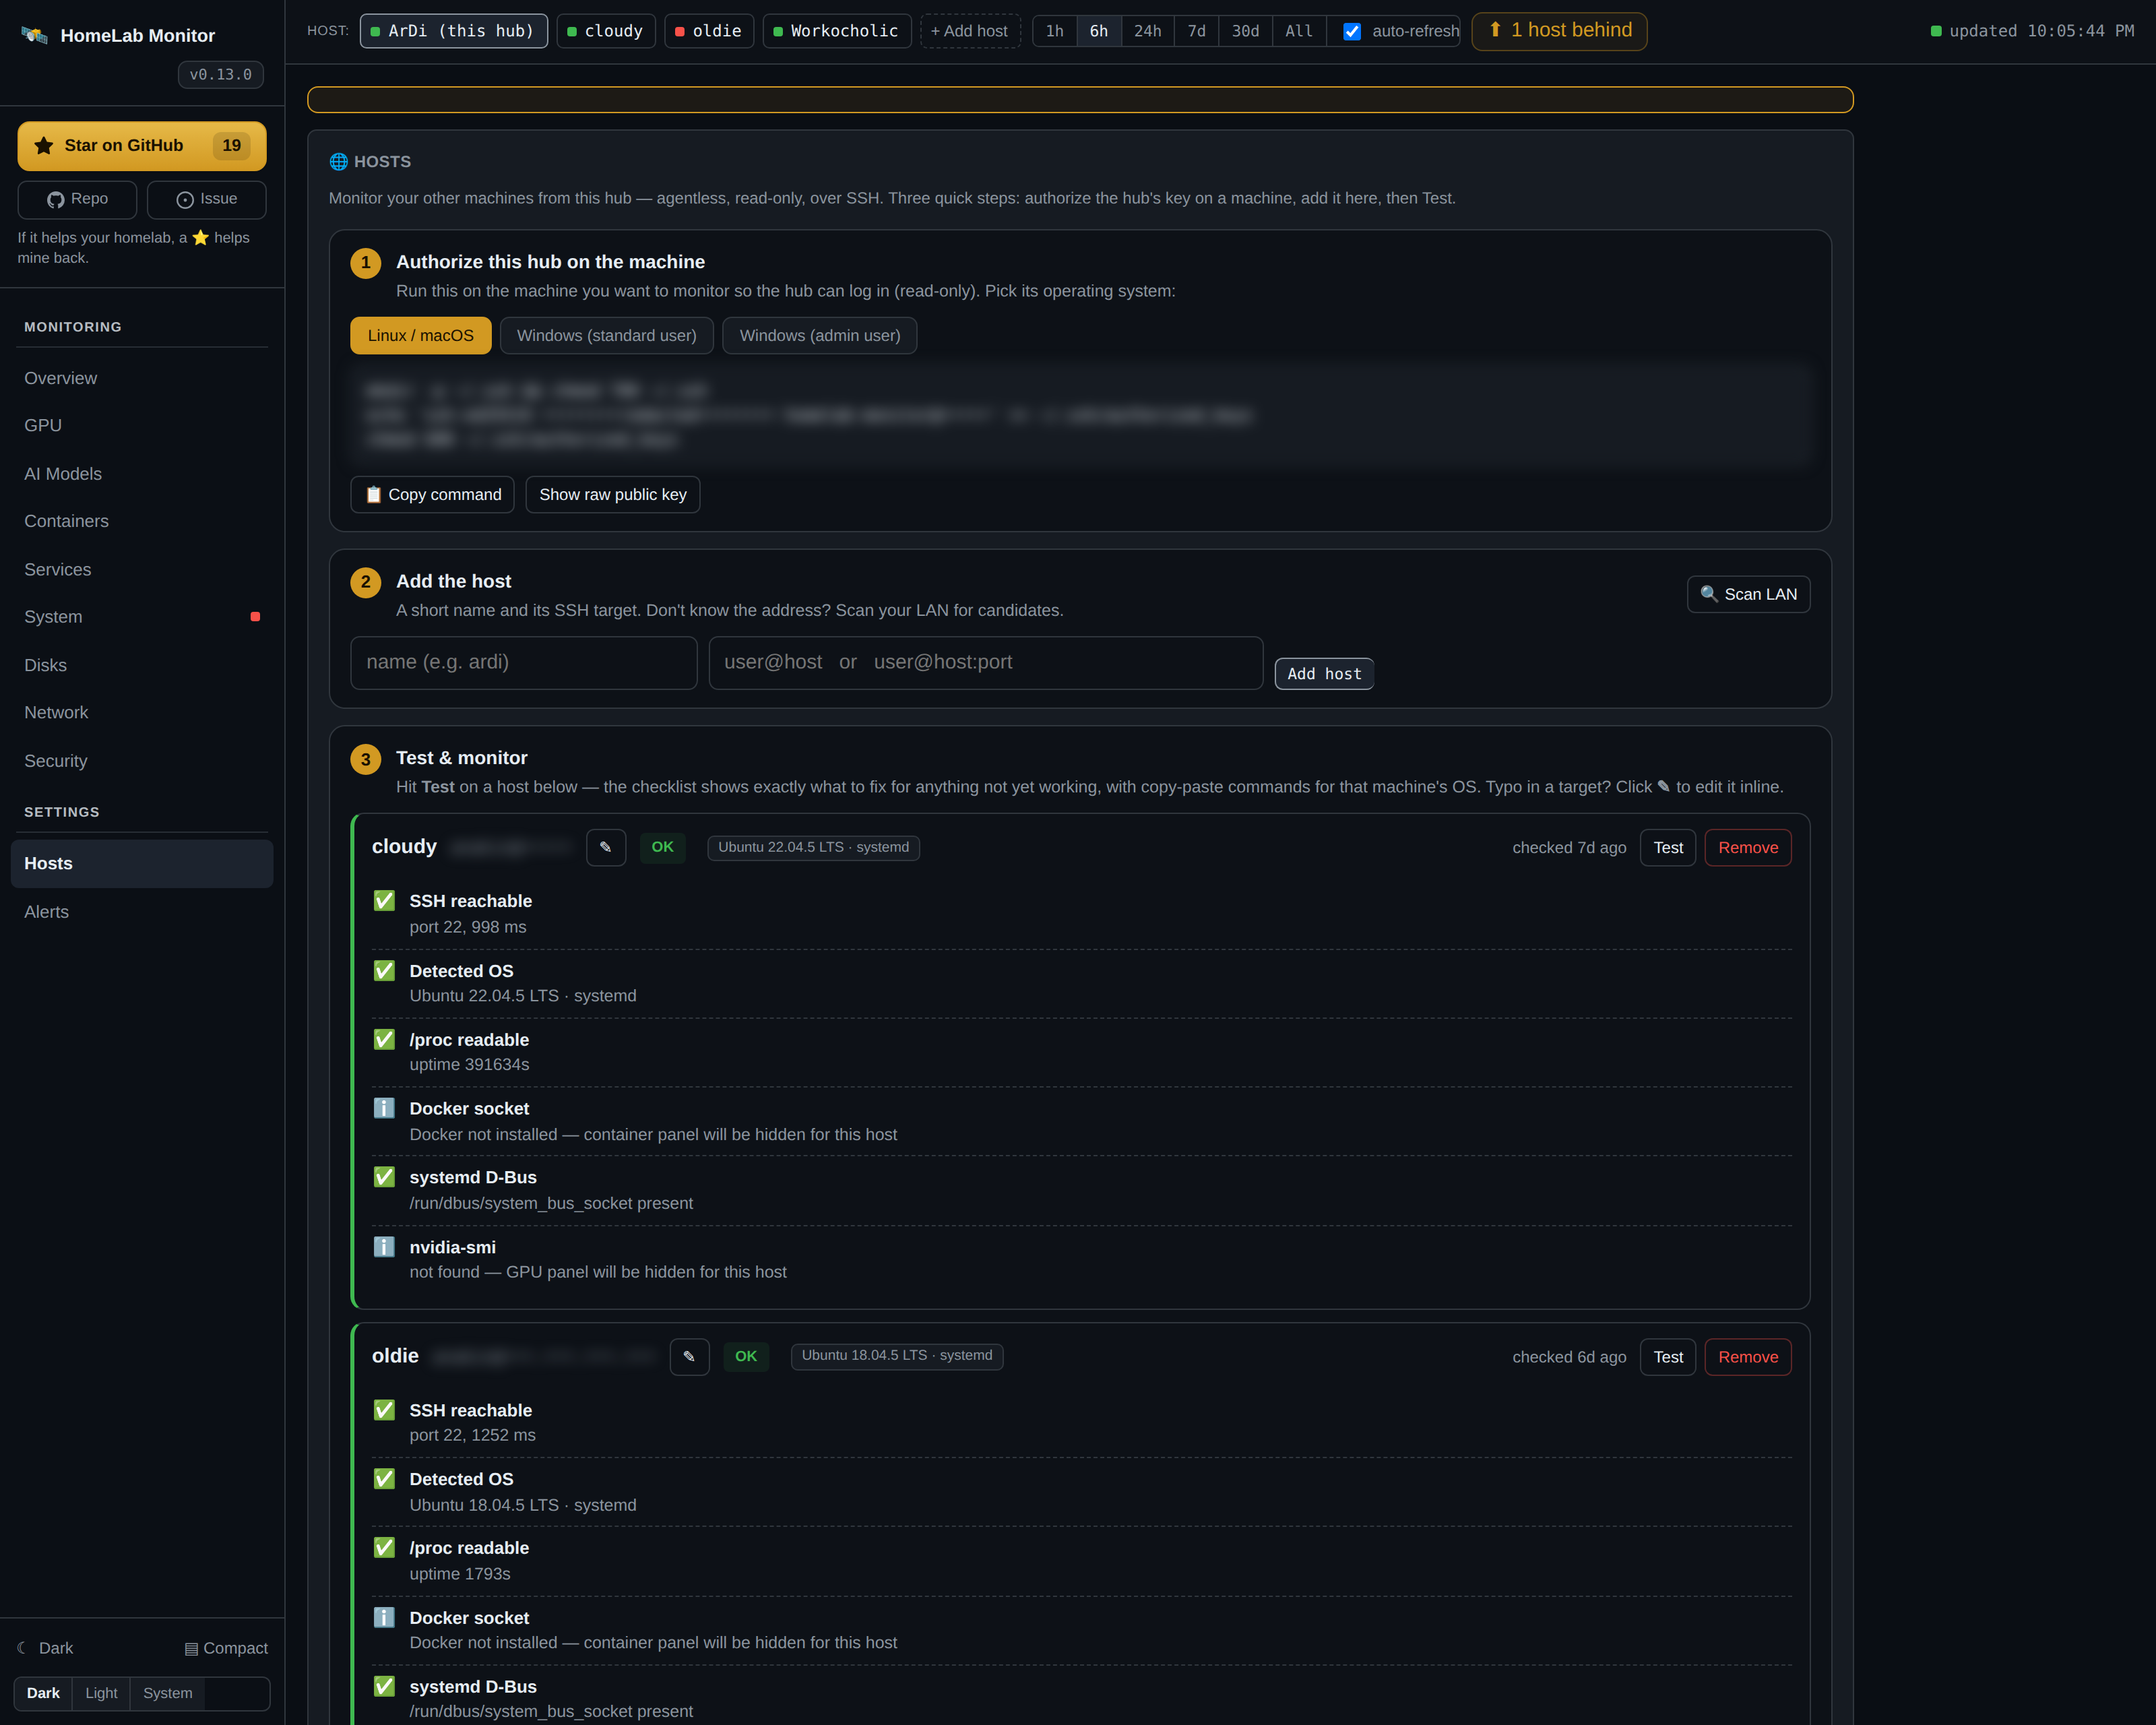
Hosts
A registry and clean three-step onboarding: authorize the hub's key (with the exact command for the remote's OS), add a host — Linux, a Raspberry Pi, or Windows — and run a per-capability Test connection. For anything not yet working it shows the precise fix command for that machine's OS, and ▶ Run on remote applies it without leaving the dashboard. See Multi-machine monitoring.
History is stored in SQLite and downsampled on read, so a six-month view loads as quickly and reads as cleanly as the last hour.