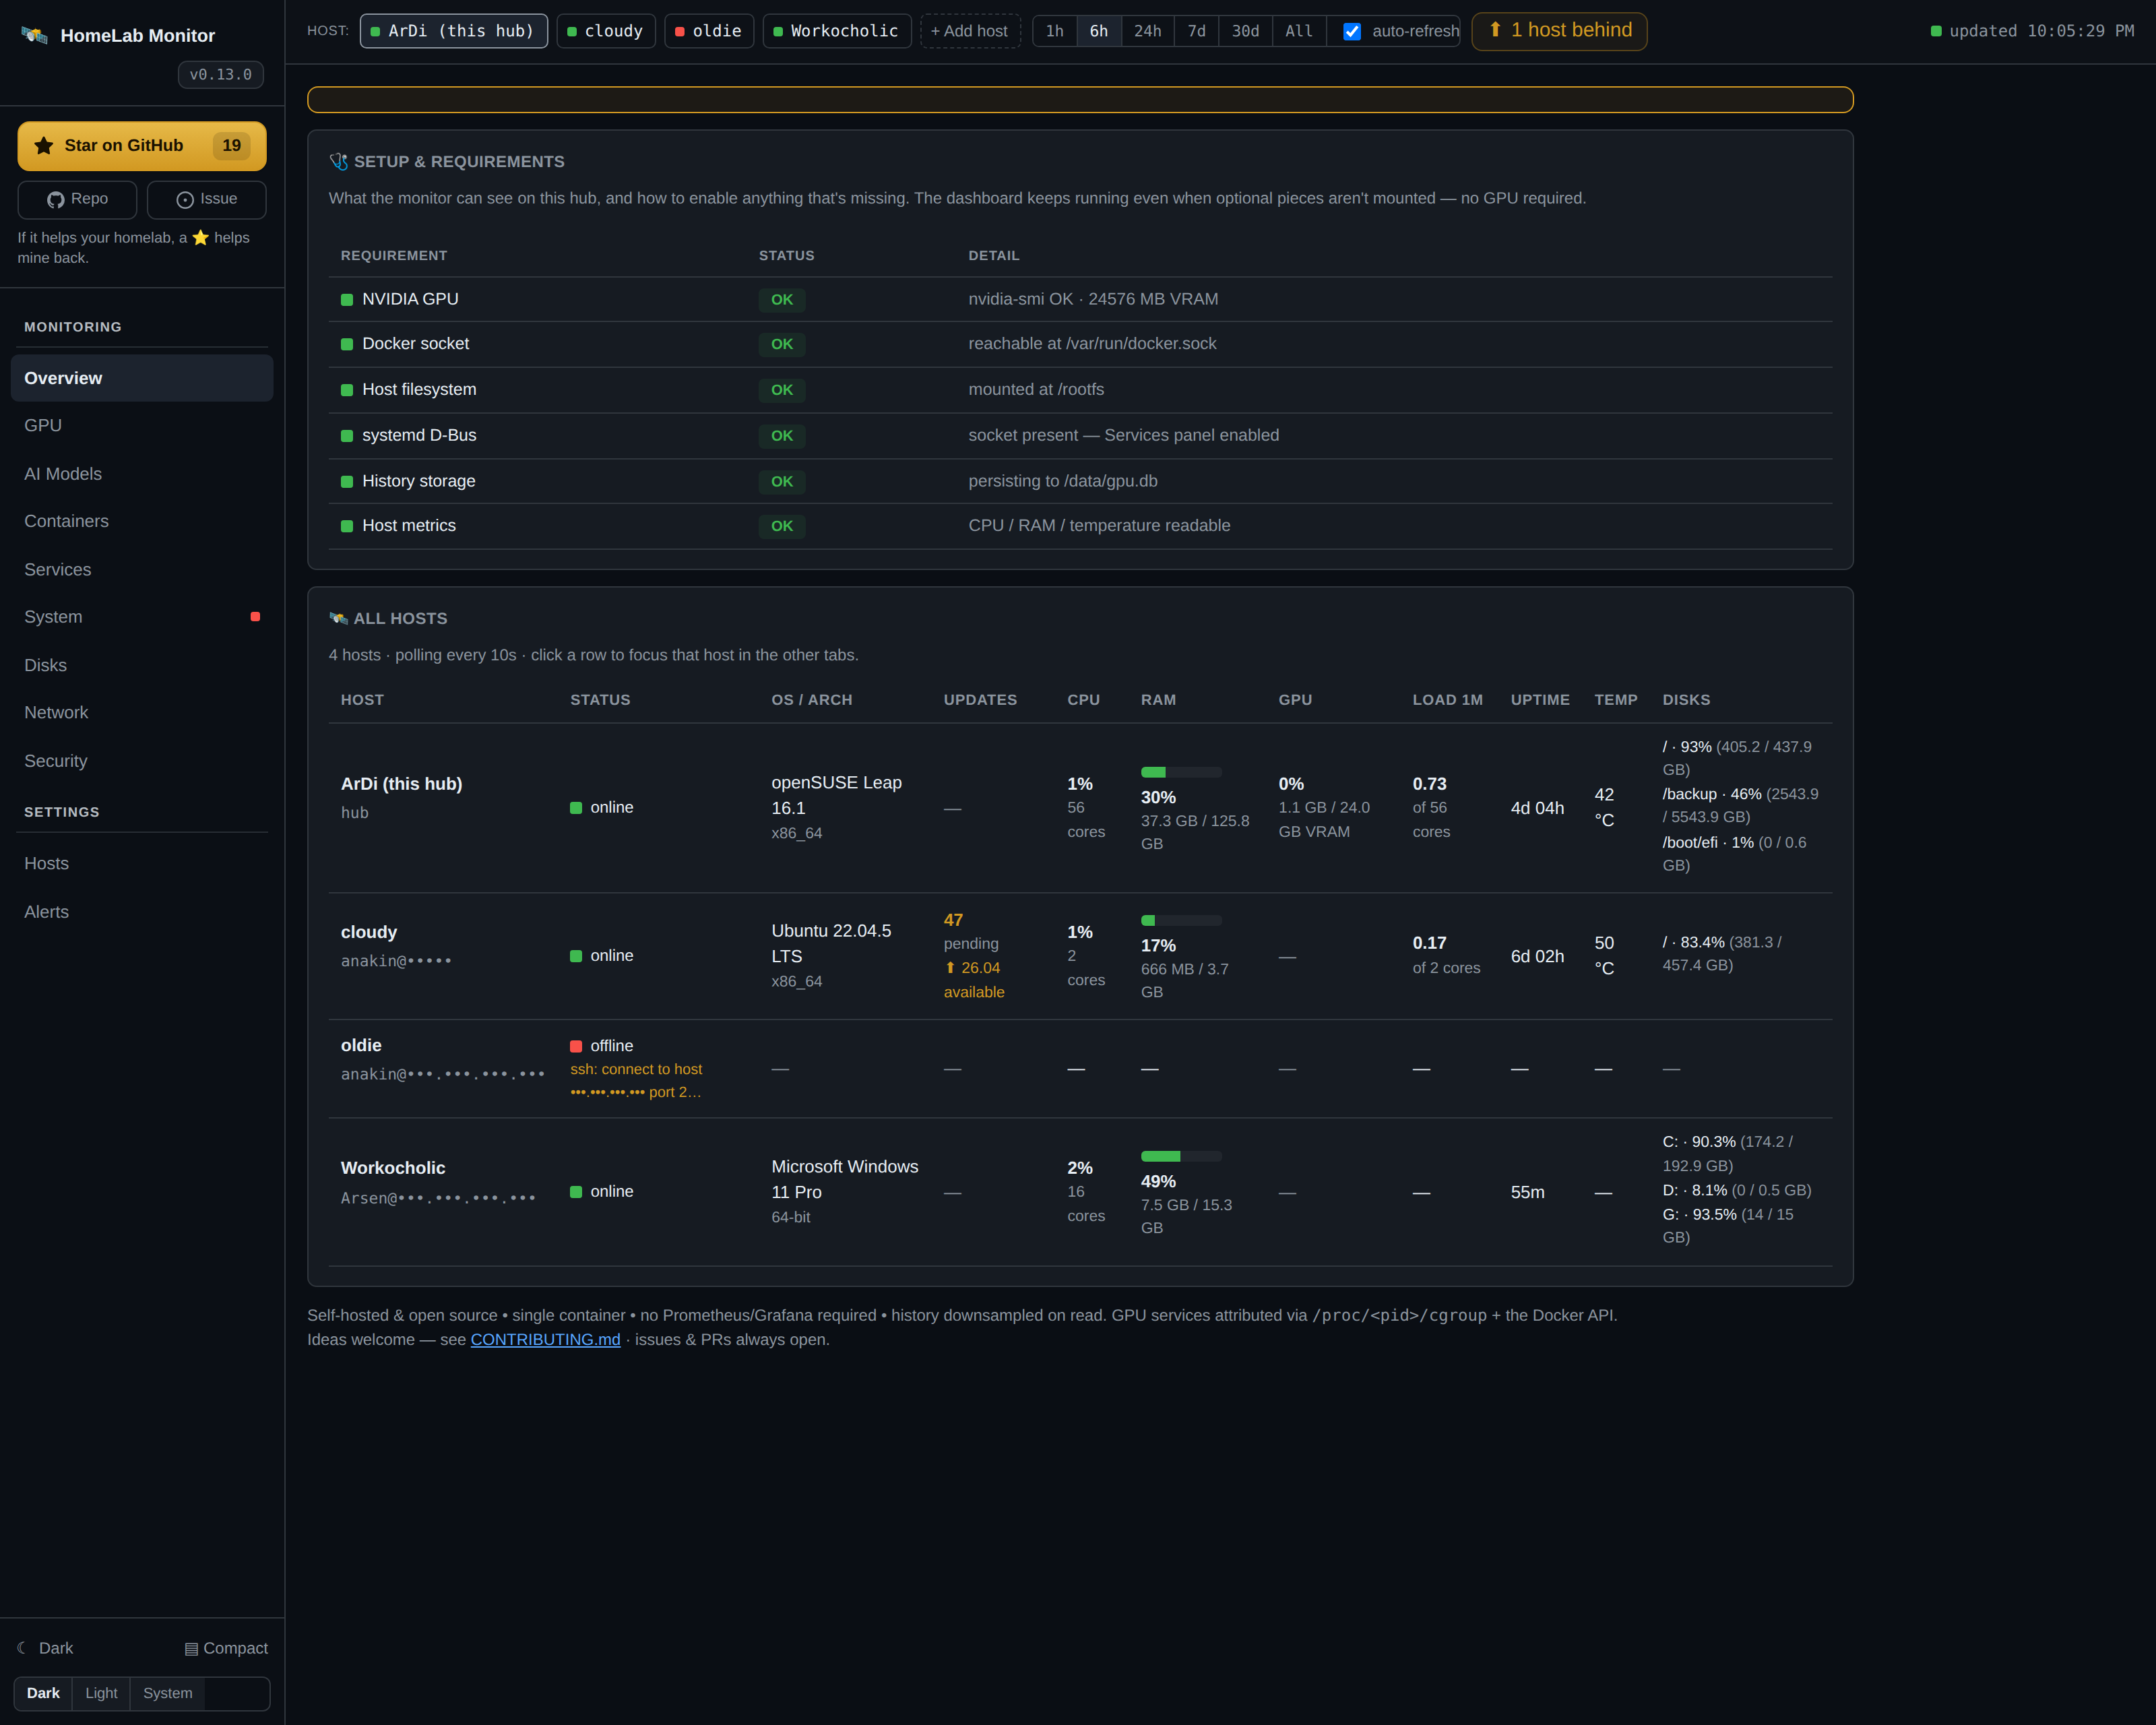
Multi-machine monitoring
A homelab is rarely one machine. Since 0.8, HomeLab Monitor watches every
box you register over SSH and shows them side-by-side in one cockpit. No
agents, no installs on the remote — just an SSH key and python3.
How the loop works

Each cycle the hub pipes a tiny probe.py through ssh user@host python3 -.
The remote runs it, prints one JSON blob (CPU/RAM/load/uptime/disks/temp +
optional nvidia-smi, systemctl list-units), and exits. Nothing persists
on the remote. The hub caches the latest blob per host and the UI reads it
from /api/fleet and /api/host_data/<name>.
Adding a host (4 steps)
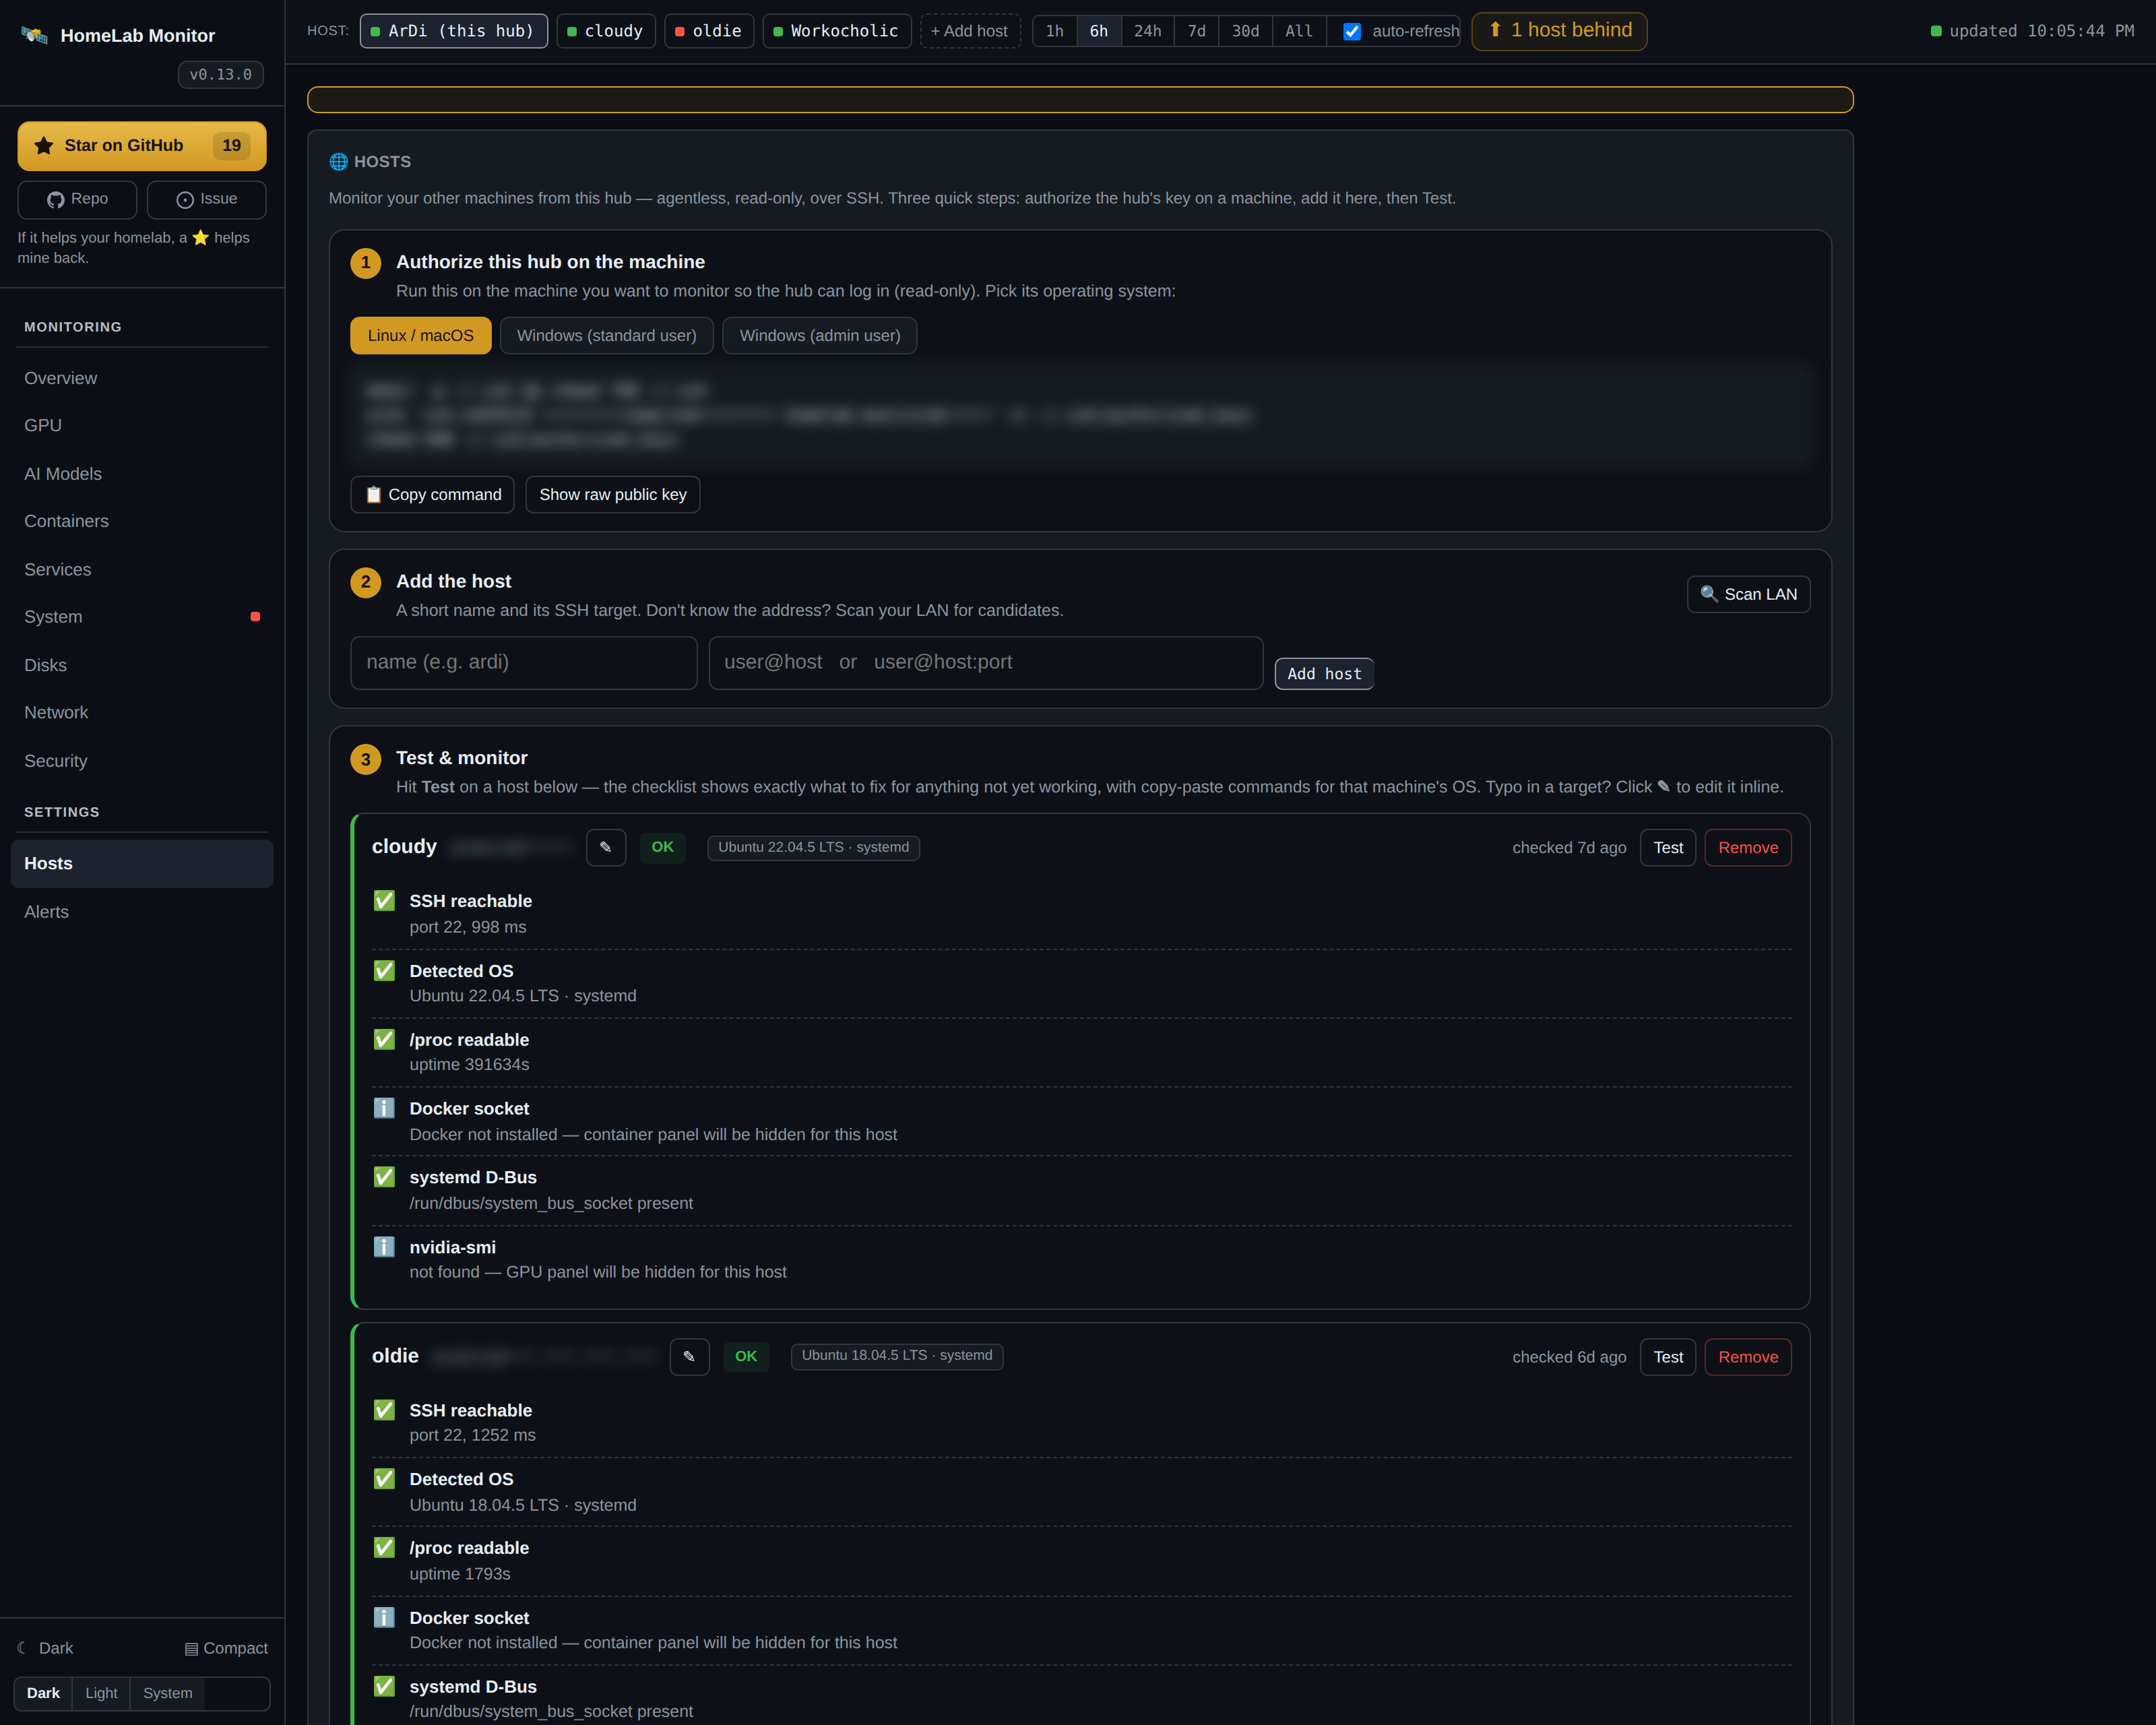
1. Open the Hosts tab
You'll see two main panels:
- The hub's public key (a fresh ed25519 keypair generated under
./data/.ssh/on first boot; it survives rebuilds). - An add-host form with a
🔍 Scan LANbutton.
2. Discover or type the target
Click 🔍 Scan LAN to get suggestions from the kernel's ARP cache and a
quick TCP-22 sweep across your local subnets. Click Use → to prefill the
form, or just type user@host[:port] yourself.
3. Hit Add host, then Test
The probe runs a real per-capability checklist. Each row is green / amber / red with a precise reason and — for amber/red — an inline command:
| Check | What it confirms |
|---|---|
| ✅ SSH reachable | TCP-22 open, key auth works (with measured RTT) |
| ✅ Detected OS | Pulled from /etc/os-release (e.g. Ubuntu 22.04.5 LTS · systemd) |
| ✅ /proc readable | Linux kernel — host vitals will work |
| ⚠️ Docker socket | If permission denied, you get the exact usermod -aG |
| ✅ systemd D-Bus | Services tab will work for this host |
| ℹ️ nvidia-smi | If absent: "GPU panel will be hidden for this host" |
4. Fix amber/red rows with ▶ Run on remote
Don't copy-paste the command into another terminal — click ▶ Run on
remote. If the command needs sudo, the panel asks for the password with a
clear:
🔒 Used once, not stored, never in argv
The sudo password is piped via your local subprocess's stdin → ssh's
encrypted channel → sudo -S -p '' on the remote. It is never in any
process's argv on either side, never persisted to SQLite, never
written to logs.
The output (stdout / stderr / exit code) renders inline. Hit ↻ Re-test once the fix is done.
That's it — the hub picks up the host on its next poll cycle (~10 s) and the Overview row populates.
What's local-only (for now)
Per-host System, Network, Security and Services tabs work for any registered remote. GPU / AI Models / Containers tabs are local-only this slice and tell you exactly why for the active host — read from that host's own capability check:
- "cloudy has no NVIDIA GPU" —
nvidia-smiwas absent during Test. - "Docker is not installed on cloudy" —
dockerCLI wasn't found. - "Per-host GPU view is on the way" — host has the capability; per-host collection lands in the next release.
Tracking the full multi-machine design in Issue #35 — data model, cockpit grid, topology view, alerts roll-up, all sliced into follow-up PRs.
Windows hosts
A registered host can be Windows, not just Linux. When the hub detects a Windows
remote it pipes a PowerShell probe (probe.ps1) instead of probe.py — over the same
SSH key, with nothing to install: PowerShell and WMI are already on every
Windows 10/11 / Server box, the way Python 3 is on Linux. You get the same fleet row
plus the System (CPU/RAM/disk/hardware), Network (NICs, listening ports, DNS,
gateway) and Services (Windows services) tabs, and the GPU tab too when
nvidia-smi is on the host.
To add one:
- Enable the built-in OpenSSH Server on the Windows box:
- Drop the hub's key into the user's
~/.ssh/authorized_keys. For an admin account, OpenSSH reads a shared file with a strict ACL instead — the Hosts onboarding shows the exactadministrators_authorized_keys+icaclscommand (just pick Windows (admin)). - Add it on the Hosts tab as
user@windows-host.
SELinux/AppArmor, load-average and systemd rows are simply omitted — they have no Windows analogue. The Memory-map treemap groups RAM by Windows service (handy here, since a Windows box has no containers).
Reliability
- Per-host SSH timeouts so a slow remote can never block the poll loop.
- Errors keep last-good data — if a cycle fails, the cache retains the
previous snapshot plus an
errorfield. The Overview row goes "offline" with that message; nothing flaps. - Only OK/warn hosts are polled — a host with a hard-fail last Test isn't probed at all (no point hammering a closed port). Re-running Test re-enables it.
- Stale detection —
online: falsewhen last data is older than 3× the poll interval (30 s). UI dims the row.